When measuring equipment it’s important to understand some relationships between frequency response and distortion. This helps interpret results correctly and not go chasing ghosts.
Here is the distortion from my Magnepan 3.6/R speakers measured from the listener position using REW, and a Tascam DR40 recorder:
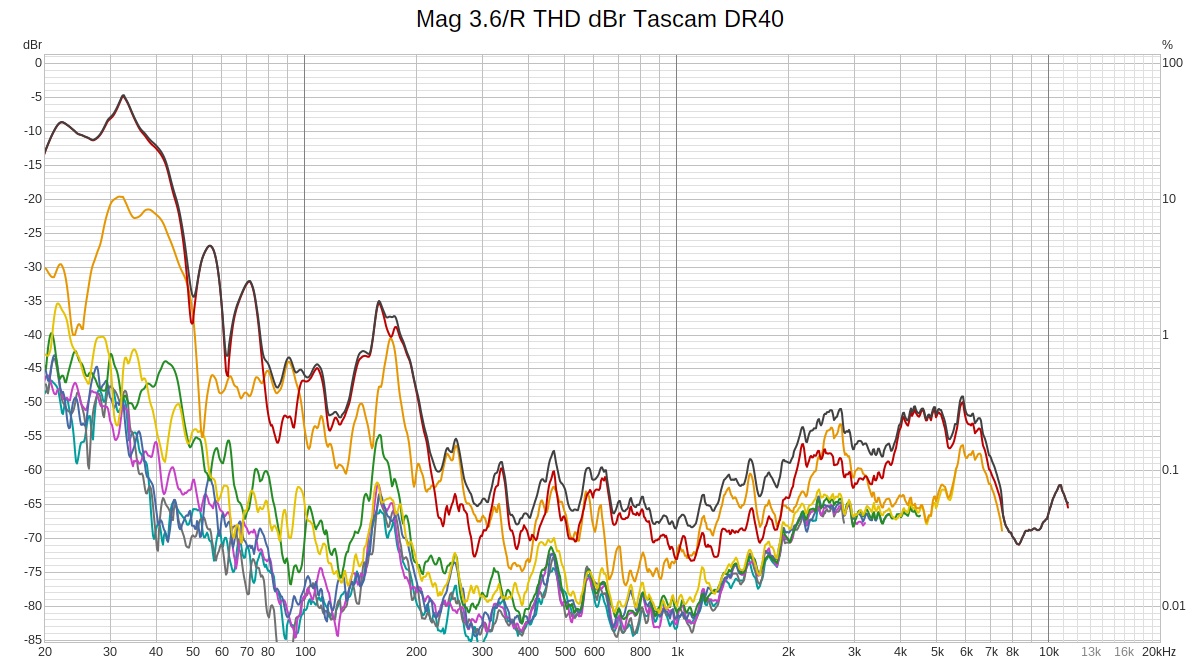
Overall it’s excellent for an in-room loudspeaker measurement. Distortion is below -40 dB (1%) above 60 Hz, drops to -50 dB (0.3%) by 200 Hz, and ranges from -50 to -60 dB (0.3 – 0.1%) in the mids & treble where our hearing is most sensitive to it. This is less distortion than most quality headphones. And it’s actually even lower than this because it includes the room’s ambient noise and distortion from the Tascam DR40 built-in mics.
However look at that big distortion bump around 170 Hz. What’s going on there? The short answer is nothing – it is a measurement error. To see this, look at the frequency response:
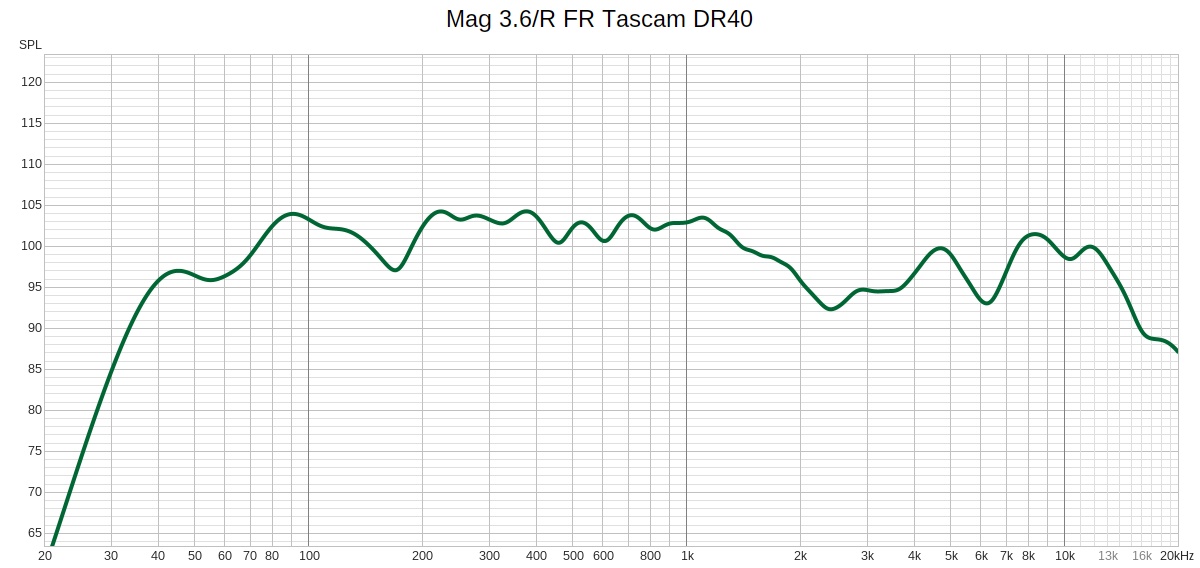
See that dip at 170 Hz? It’s caused by a null. Its wavelength matches twice the distance from the speakers to the front wall. With dipoles, the back radiation is inverted polarity from the front, so its cancels at that frequency, creating a null. Note that this null exactly matches the frequency where the distortion graph bumps. That’s no coincidence!
When REW runs the frequency sweep, the response picked up by the microphone dips at 170 Hz. Distortion is the ratio of higher frequencies to the fundamental, and when the fundamental drops, that ratio jumps even if the higher frequencies (distortion) remains constant.
On a similar vein, the graphs show small distortion bumps at 450 and 600 Hz, corresponding to frequency responds dips at the same places.
A closer look reveals more subtle effects of the same cause. If the response dips at 170 Hz, then any 2nd harmonic from half that frequency won’t get picked up either, so that frequency will show a dip in 2nd harmonic. This explains the dip in the red line (2nd harmonic) at 85 Hz. Same with 3rd harmonic, and we see a dip in the orange line (3rd harmonic) at 57 Hz.
To confirm, here’s that same distortion graph shown as dbFS: absolute level instead of relative to the fundamental:
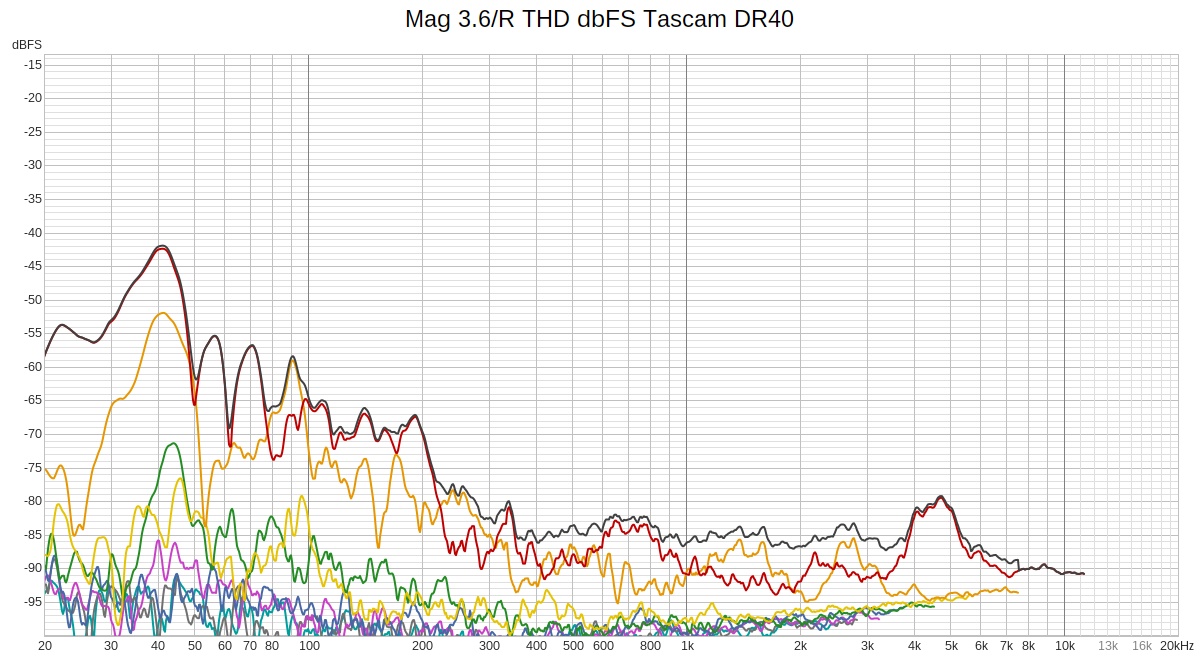
The scale shifted about 20 dB down but the shape of the curve is the key point.
Pretty cool, huh?