Category Archives: Flying

Stratux

Summary

Stratux is an ADS-B “In” device for pilots. I built one back in 2016 and still use it today. It’s served me reliably for more than 1000 hours of flying all over the western USA, Canada and Alaska.

Stratux features

  • FIS-B: Flight Information Services Bundle, which includes
    • ADS-B “In”: live traffic – other airplanes flying nearby
    • Weather: near-real-time
      • METAR and TAF
      • NEXRAD radar
      • AIRMETs and SIGMETs
      • PIREPs
    • TFRs: temporary flight restrictions
  • GPS: a built-in GPS that is faster and more accurate than the built-in GPS in most phones and tablets

How Stratux works

Stratux is open source software that runs on a Raspberry Pi computer. The Pi has some dongles plugged into its USB ports to handle the radios (ADS-B, GPS), and a couple of small antennas to pick up the radio signals. Parts include:

  • Raspberry Pi 3B (or later) with SD card
  • ADS-B 978 dongle
  • ADS-B 1090 dongle
  • GPS dongle
  • Barometric sensor dongle
  • Antennas for the dongles.

Mandatory minimum parts are in bold face.

The Stratux picks up data in real-time over the antenna, processes and converts the data, and transmits it on a local Wi-Fi broadcast from the Raspberry Pi.

How to Build a Stratux

Building a Stratux is simple:

  • Buy the parts
  • Plug them into each other
  • Download the software
  • Copy it to the SD Card
  • Plug the SD Card into the Raspberry Pi

How to Use a Stratux

Before using a Stratux you need to make 2 decisions about where it will fit in your airplane:

  1. How to get its antennas to see the sky
  2. How to feed it power (a USB cable)

The most common way is to put the Stratux on top of the aircraft panel, where small antennas plugged into it can see the sky. Stratux is small and light enough you can do this with velcro tape.

The next most common way is to put the Stratux behind the panel (where you can’t see it). Then you need to find another place to put the antennas with wires connecting them to the Stratux.

When the Stratux is in your airplane and turned on, it broadcasts a local WiFi signal. Connect to its WiFi on your phone or tablet. Virtually all EFB software can show the data, so whatever you already use on Apple or Android (Foreflight, Droid EFB, Garmin Pilot, etc.) will work.

How Much Does a Stratux Cost?

If you buy one pre-built ready to plug in and use, they start around $400, like this one.

If you build it yourself, the price starts around $115 and goes up from there depending on how much functionality you want.

Bill of Materials

  • Raspberry Pi 3B+: $53
  • UAT Radio: $40
  • Micro SD Card: $20
  • GPS dongle: $20
  • 1090ES & UAT Radios (pair): $75
  • AHRS sensors: $40
  • Fan & heat sink: $6

From the above, you can build a Stratux as cheap as about $115. Add another $20 if you want GPS. Add $35 ($75 – $40) if you want ADS-B on both UAT and 1090. Add another $40 if you want an AHRS sensor.

The software automatically detects and uses whatever is plugged in, so setup is simple to non-existent.

References

Stratux home: https://stratux.me

Maneuvering Speed: Va

Summary

Maneuvering speed (Va) is the airspeed at which sudden full deflection of flight controls will not break the airplane (e.g. rip the wings off). At and below Va, the airplane will stall before it breaks.

Generally, Va does not impose a speed limit on the airplane because normal flight (standard maneuvers and light turbulence) does not create strong enough forces to threaten the aircraft’s structural integrity. Va becomes important during moderate turbulence, unusual maneuvers, or any time the airplane will be subjected to sudden powerful accelerations.

This is an important concept for pilots. Yet like many things with aviation, it’s important to fully understand it, not just to memorize it.

The simple memorization is that the Va published in the aircraft’s pilot operating handbook (POH) is at max gross weight (GW), and gets slower as the airplane is lighter. Normally, most airplanes are operated well below max gross weight, so the Va pilots should use is slower than what is published. However, this is over-simplified. All else equal, Va  does get slower as the airplane gets lighter – but all else is not always equal. A full understanding of Va reveals why.

Where Does Va Come From?

The idea behind Va is that the faster an airplane goes, the more force the wing would sustain in a sudden deflection or gust of turbulence. Why? Because lift depends on both airspeed and Angle of Attack (AoA). The faster an airplane flies, the less AoA you need to generate the same lift. And vice versa. So as the airplane speeds up, it has to be nosed down (reduce AoA) to prevent climbing.

A wing always stalls at the same maximum AoA, regardless of airspeed or orientation. Thus, the less AoA necessary for level flight, the more AoA can be increased before a stall occurs. The G factor or acceleration of the airplane is proportional to the change in AoA. Thus a lower AoA in level flight means there is more “headroom” for AoA to increase before reaching the max AoA. Thus, a bigger G load can be exerted on the airplane before the wing stalls.

Forces Versus Gs

Yet breaking something requires force. A G is not a force, but a ratio of forces. A G becomes a force only when multiplied by the mass being accelerated. The strength of a wing is measured in pounds, not in G. Imagine that the strength of a wing is the amount of weight that can be suspended from the wing before it breaks. A light airplane exerts less force on the wings than a heavier airplane, when pulling the same G load.

For example, consider the airplane at two different weights: max gross (say, 2500 lbs.) and half of that (1250 lbs). Pulling 4 Gs at 2500 lbs. exerts a force of 4 * 2500 = 10,000 lbs. on the wing. That is the same as pulling 8 Gs at 1250 lbs. When the airplane is lighter, it can withstand a higher G load because it exerts the same total force.

But that’s not entirely true… there’s more to the story.

Va and Airspeed

Suppose the operational service strength of the wing is 10,000 lbs. and Va is 100 knots. This is the speed at which, when the elevator is suddenly fully deflected from level flight, the wing stalls just before generating 10,000 lbs. of lift force. Normally, Va is equal to the clean stall speed of the aircraft (Vs), multiplied by the square root of the designed maximum G load. Suppose for our example airplane, Vs is 50 kts and the max G load is 4, so Va will be 50 * sqrt(4) = 100 kts.

What happens when the airplane is lighter than its GW of 2500 lbs? There are two factors to consider:

  1. When the airplane is lighter, the same G load makes less total force on the wings. Since the wing’s strength is based on force, not on G load, the wings can sustain whatever higher G load produces that same force.
  2. When the airplane is lighter, the wing needs to generate less lift in level flight, which means less AoA at the same airspeed, which means there is more AoA “headroom”, which means sudden max deflection of the controls will pull more Gs.

These two effects are opposite and cancel each other. In short, the airplane can pull more Gs from level flight, but that higher G load represents the same force on the wings. Thus, it would appear that Va should be unaffected by airspeed.

An Airplane is More than a Set of Wings

But what about the rest of the airplane? What about the engine mounts, the battery, the seats, etc.? Suppose our 2,500 lb. GW airplane’s engine weighs 250 lbs. At the designed load of 4 G, the engine mounts are withstanding 1,000 lbs. of force. Now if the airplane is flying at 1,250 lbs. (half its GW), at airspeed Va, and the pilot suddenly fully deflects the elevator, we just subjected it to twice the Gs. The airplane overall has half the weight, so twice the Gs exerts the same total force on the wing, no problem. But the engine weighs the same no matter what the airplane weighs. Subjecting the airplane to twice the G load exerts twice the force on the engine mounts. We just subjected the engine mounts to 2,000 lbs. of force, twice their design limit.

When the airplane is lighter, it can pull more Gs, which puts more stress on components like the engine mounts, since the engine always weighs the same.

Thus, Va may be slower when the airplane is lighter. When the airplane is lighter, it can pull more Gs. This won’t break the wing, because higher Gs at lighter weight is the same total force on the wing. But it can break the engine mounts, battery box, etc. because – and this is a very important key point – even though the overall airplane is lighter, these individual parts always weigh the same and are being subjected to more Gs.

How Weight Affects Va

As the airplane gets lighter, Va may get slower, but won’t necessarily get slower.  It depends on the weak point of the airplane. Are the airplane’s fixed weight components (engine mounts, battery box, seats, etc.) strong enough to withstand the higher forces?

If all of the airplane’s individual components have the same G load limit, then Va will get slower as the airplane gets lighter, because higher G loads exert stronger forces on components that weigh the same regardless of the airplane’s overall weight.

HOWEVER… if the airplane’s fixed weight components can withstand stronger forces, then Va might be just as fast at slower speeds as it is at GW.

In most cases you won’t know. Airplane manufacturers certify the airplane at gross weight. They may not test other configurations that aren’t required for certification. Absent this testing, you must assume that Va gets slower when the airplane is lighter, to avoid exerting forces beyond the certified limits.

Put differently: when lighter than max GW flying at the published Va airspeed, you can pull more Gs before the airplane stalls. That higher G load represents the same total force on the wings (because the airplane is lighter), so the wings are safe. But that higher G load exerts a greater force on individual fixed weight components, so they could break.

Normal versus Utility Category

Airplanes certified for utility category can withstand at least 4.4 G. Some airplanes (like the Cessna 172) are certified for normal category (3.8 G), but when total weight is below a certain limit and center of gravity is forward of a certain point, they are certified for utility category.

The aforementioned fixed mass components of the airplane (engine, battery, seats, etc.) don’t know or care about the airplane’s loading or center of gravity. They always weigh the same and feel the same forces at the same G load. For example if the airplane is certified for utility category and the engine weighs 250 lbs., then the engine mounts can withstand at least 250 * 4.4 = 1,100 lbs. of force.

To clarify, in normal category the Cessna 172 is rated to withstand 3.8 G. But since it also certified for utility category, it can withstand 4.4 G when its overall weight is under 2100 lbs. Yet individual parts like the engine, battery, seats, etc. always weigh the same and don’t structurally change. These individual components can always take 4.4 G.

Because of this, the airplane’s Va might not get slower when it’s lighter than GW, because the fixed mass components can handle more than 3.8 G. But they do have a limit of 4.4 G, and how does a pilot know when the airplane has gotten light enough to pull a G load greater than 4.4 without stalling?

Quantifying it Further

Let’s do some math and physics. Stall speed varies with the square root of the weight ratio. Suppose the airplane’s published stall speed in the clean configuration (Vs) is 50 kts at 2500 lbs., and Va is 100 kts.

If the airplane is loaded to 2,025 lbs., that’s 81% of its GW. The square root of 0.81 is 0.9, so the stall speed is 90% of 50 kts = 45 kts.

Using the formula stated earlier we can compute Va at this lighter weight. Suppose the G rating is 4.0. Then 45 knots times the square root of 4 equals 90 knots.

We see that Va (and stall speed) both depend on the square root of the ratio of the airplane’s weight, and both get slower when the airplane is lighter.

Now let’s take exact numbers for a Cessna 172 and see what happens:

The POH gives Vs = 51 knots at gross weight 2550 lbs. and Va = 99 knots, in normal category (max G load 3.8). This is near exact to what the formula predicts: 51 * sqrt(3.8) = 99.42.

The same airplane is rated utility category at 2100 lbs. Let’s compute what Va should be.

At 2100 lbs. the stall speed is now sqrt(2100/2550) * 51 = 46.3 knots.

  • If the airplane was not certified for utility category, Va would be 46.3 * sqrt(3.8) = 90 knots.
  • But it is certified for utility category, so the max G load is 4.4, so Va is 46.3 * sqrt(4.4) = 97 knots.

We can see that being certified for utility category makes a big difference keeping Va almost constant as the airplane gets lighter. When gross weight drops by 18% (2550 to 2100), Va would normally drop by 9% to 90 knots. But because this airplane is certified for higher G loads at lighter weights (utility class), Va drops by only 2% to 97 knots.

LineageOS on Tablets (and Airplanes)

Introduction

When I first started flying airplanes we used paper charts and books for maps and airport information. Every couple months we bought updates and most of us subscribed so they were sent in the mail as soon as they were published. Soon afterward, electronic versions of this became available and eventually the FAA revised their rules to accept these electronic versions. We now call this an “Electronic Flight Bag” or EFB.

Since then, I have used Android tablets and software for my EFB. I fly with a kneeboard for ease of checklists and writing (paper & pencil) and use a tablet that fits into my kneeboard. In the early days big tablets were too thick and heavy so I used a 7″ tablet. That’s pretty small for reading charts and procedures. Over time tablets got thinner and lighter and now I use a 10.5″ tablet. This measures as 9.5″ tall and 6.5″ wide; Android tablets are less square than iPads, which is a good thing since they fit better into kneeboards.

An EFB device doesn’t need a fast processor or fancy graphics or the latest version of software. The most important factors are:

  • Size: fits where you want – whether your kneeboard or elsewhere
  • Battery life: lasts all day, or as long as you need for a day of flying
  • Screen: bright enough to see in daylight
  • Connectivity: has WiFi, Bluetooth, Mobile data, or whatever you need in your airplane
  • Software: can run your EFB applications, usually means no more than 5 years old

My Airplane

Years ago I built a Stratux, which is a Raspberry Pi that provides ADS-B “In” and precise GPS. It broadcasts this data over a local WiFi in my airplane. It does not have or need internet access. The ADS-B “In” includes traffic (airplanes in the sky near me), weather, and NEXRAD imagery all updated in near-real-time.

Because of the Stratux, my EFB device only needs WiFi. It doesn’t need its own GPS, Bluetooth, or Mobile data, though it’s nice to have built-in GPS in case the Stratux fails. It’s also nice to have an ambient light sensor so the screen can automatically adjust to flying at night.

EFB Tablets

For several years I’ve been using an old cheap Lenovo 8505F. It’s been abandoned by the manufacturer and stuck on Android 10 for a long time. The battery health is deteriorating. And it’s so slow it’s frustrating to use as newer software gets more bloated expecting ever faster devices.

I decided to get a tablet that is officially supported by LineageOS, since then I won’t be stuck with planned obsolescence on an ancient version of Android. This led me to the Samsung Galaxy Tab S5E. I found one on eBay for $100 in really nice condition, like new.

LineageOS

After booting up the new tablet and ensuring all its functions worked, I followed the procedure to install LineageOS. It typically goes like this:

  1. Unlock the device bootloader.
  2. Load a custom boot image.
  3. Load a custom recovery.
  4. Load the LineageOS operating system.
  5. Load the Google Apps.

Step 1 used to require hacking, but in recent years more manufacturers provide an official way to unlock the device.

Steps 2 through 5 are done using Google Android Tools ADB (free and open source) or manufacturer-specific tools like Samsung’s Odin. The steps can be tedious: one small mistake can cause the installation to fail or even brick the device.

LineageOS is the open source version of Android. It has a simple clean interface and no bloat-ware from manufacturers or carriers. Devices usually have better performance and longer battery life when running LineageOS, compared to their OEM software. And LineageOS offers support as long as developers care to maintain it – no planned obsolescence. For example, this Galaxy Tab S5E came out in 2019 on Android 9. Now in 2025, mine runs LineageOS 22 which is Android 15.

The biggest issue with LineageOS is device support. If you want to run it, you need to visit the site and check what devices (whether phones or tablets) are supported. Tablet support is more limited than phones: only the Google Pixel and various Samsung Galaxy models. Even so, Samsung made some of the best Android tablets and they work even better on LineageOS.

DME and its Limitations

What It is

DME means “Distance Measuring Equipment”. It is a navigation instrument used in airplanes. DME predates the era of GPS, but it still used. To understand what DME is, it helps to first understand what a VOR is, because DME facilitates navigation by VOR. I assume the reader is already familiar with VOR.

DME operates at frequencies in the 1 GHz range (960 to 1215 MHz), nearly 10x higher than VOR (108 – 117.95 MHz). DME ground stations are virtually always colocated with a VOR. To use the DME you tune it to the same frequency as the VOR. Yet how can that be, if the DME operates at a higher frequency? Every VOR frequency has a specific designated DME frequency. When you tune the VOR frequency into a DME, it looks up the corresponding DME frequency and uses that instead of what you tuned.

Why do things this way? Since VOR and DME stations are virtually always colocated, tuning the same frequency for both the VOR and the DME is convenient and reduces pilot workload.

How it Works

Unlike a VOR, which is receive-only, a DME both receives and transmits. The DME in the aircraft transmits a pulse, the DME ground station receives this pulse and transmits a reply. The DME in the aircraft receives this signal from the ground station and uses the time elapsed (the speed of light, plus a fixed latency) to compute the distance to the ground station.

The astute reader might wonder, what if several aircraft are all pinging the same DME ground station at the same time? How does each aircraft’s DME receiver know which transmission from the ground station is for itself? The answer, in a word, is jitter. The DME in the aircraft transmits multiple pulses uniquely jittered, or spaced pseudo-randomly in time. The DME ground station transmits the reply to each aircraft with pulses using that aircraft’s jitter. The DME in the aircraft listens only to replies that have its unique jitter, ignoring the rest.

One consequence of this is that each DME ground station can support only a limited number of aircraft. That limit is around 100.

What it Provides

Distance to the ground station. This is “slant distance” which includes your altitude. A nautical mile is 6,076 feet, so if you fly directly over the DME ground station at 6,076 of altitude it will show a distance of 1.0, not zero.

Ground speed. The DME computes this from the distance changing over time, so it is the speed relative to the station. But it’s based on slant distance. If you are flying directly to or from the station, it is your actual ground speed if you are far away from the station. Yet as you get closer to the station, when flying directly overhead it will show a ground speed near zero since you’re moving almost tangent to the station directly below you. If you are flying around the station in a circle, the DME speed will be zero, since your distance to the station is not changing.

Time to the station. Some DMEs compute and display how long it will take you to reach the station, based on your distance and speed, if you fly directly toward it.

Limitations, or Ways DME can Fail

Because the DME in an aircraft must transmit (unlike VOR which is receive-only), the transmitter power is limited. The power of a DME transmitter varies by model. I’ve seen it as low as 25 watts and as high as 100 watts.

When it comes to electrical devices and circuits, receivers usually last longer than transmitters. Transmitters use more power, which is current and heat, and over time those heat cycles take their toll. Thus, while many VORs still work when 40+ years old, this is less common for DMEs.

DME frequencies are in the GHz range which is direct line of sight. And the DME antenna on the airplane is usually on the bottom of the fuselage. Thus if you don’t have a direct line of sight to the station (you’re at a low altitude, there are mountains between you and the station) it won’t work.

ADS-B Out transmits on 978 or 1090 MHz, both of which are in the same range as DME. Thus, ADS-B Out may cause conflicts and prevent DME from working.

Each DME ground station can only support a limited number of airplanes at a time. If the station is in busy airspace, it may ignore your airplane’s DME signal and your DME won’t work. Having a low powered DME transmitter exacerbates this problem, since over-saturated DME ground stations prioritize the strongest signals and ignore weaker ones.

Electronic Gyro Drift Correction

Introduction

A magnetic compass is still a required navigation instrument in airplanes. The most common type is called a “whisky compass”, mounted at the top center of the panel. The compass is tilted toward the pilot to make it easier to read. Yet this also makes it accurate only in straight and level flight. When turning, the compass’ balance masses and tilt make its reading lead or lag the airplane’s actual heading.

Most airplanes also have a directional gyro. The gyro’s rotational inertia keeps it in a stable position as the airplane rotates around it. This means it reads accurately when turning. But gyros slowly drift over time. This means during straight and level flight, the pilot must occasionally check the gyro and manually set it to the compass heading. How often is occasionally? Depends on the gyro. For gyros that are entirely independent having no external correction, it’s about every 15 minutes. And this is true whether it is mechanical or electronic.

Gyro Drift

Gyro drift is caused by two factors: the rotation of the Earth, and friction (for mechanical) or noise/errors (for electronic).

The Earth rotates through 360* every 24 hours, which is 15* per hour. The gyro is immobile in space independent of the Earth’s rotation. Thus as the Earth rotates, the gyro “moves” relative to the Earth, and since the Earth is our frame of reference, this causes the gyro to drift. The relative motion of the Earth can make a theoretically perfect gyro drift up to 15* per hour from the pilot’s frame of reference.

Bearing friction and electronic noise are more intuitively obvious causes of gyro drift. With electronic gyros we have the advantage of being able to apply software corrections. Electronic gyros are based on accelerometer sensors, which means the sensor readings must be mathematically integrated to get position. Integration cumulatively amplifies small sensor errors. For example, even if the sensor’s readings consistently average the correct value over time, each individual reading will be slightly more or less. And these accumulate over time into increasing errors.

Drift Correction

One form of drift correction is when the pilot sets the gyro to match the compass heading. Immediately after this we can assume the gyro’s heading is correct. If we store each of these changes, we have a history of how much the gyro has been drifting and can use that to auto-correct and reduce drift.

Correcting this automatically applies only to electronic gyros, since we need a software algorithm to compute and apply this.

Bias and Variance

Errors and noise fall into two categories: bias and variance. Bias refers to anything systematic or predictable, variance is the unpredictable random portion of the errors. We can detect and correct for bias but not for variance. We must be careful, because misinterpreting variance as bias can increase errors rather than reduce them.

The basic idea is that after each pilot correction, we compute the rate of drift of the correction and continue to apply that to the gyro going forward. For example, if the most recent correction was +10* and it was made 15 minutes after the prior correction, the correction is +0.667* per minute, so we automatically apply that to the gyro going forward.

However, it’s not quite that simple so the idea needs refinement.

For example, suppose the drift that the pilot is correcting reverses direction each time. In this case, if we correct as above, we would actually amplify rather than reduce the drift, making things worse rather than better.

The problem is that errors are a mix of bias and variance, yet our idea only works to reduce bias, not variance. One simple way to differentiate bias from variance is to look at whether recent user corrections all go in the same direction. When this happens, there is a simple linear component to the gyro errors: it’s consistently drifting in the same direction, whether clockwise or counter (this is not the only form of bias, but it’s the simplest and easiest to detect). Yet even a blind squirrel sometimes finds a nut, and random errors will sometimes also go in the same direction. When you flip a coin, you will sometimes get heads several times in a row.

Consider that with variance (completely random errors), each pilot correction is 50% likely to be in either direction, like flipping a coin. If you flip a coin twice, you get 2 heads or 2 tails half the time. Similarly, with pure variance and no bias, about half the time each pilot correction will be in the same direction as the prior correction. Three consecutive corrections in the same direction would happen about 25% of the time. Conversely, we can say that in this case the error is 75% likely to have some bias.

So we should not apply our automatic correction unless the most recent N pilot corrections were all in the same direction, and N should be at least 3. Also, we should shrink the auto-corrected rate accordingly. For example when N=3 the error is 75% likely to have some bias, but it will always have some variance too. So let’s assume that 75% of the error is bias and shrink the correction applied going forward to 75% of the pilot-entered value. In the above example, the +0.667* per minute becomes 0.5* per minute.

Oscillation and Damping

At this point we have a simple algorithm that should improve the gyro accuracy. Yet we can improve it further without adding complexity. The idea is that our method to discern bias from variance is always imperfect, and if we get it wrong it makes things worse, not better. It is better not to correct errors, than to make them worse. Put differently, if we are too aggressive with error correction we can make things worse, while if we are too passive or conservative, it still improves things just not as much.

So, we will apply a damping factor to our corrections, shrinking them just a bit. Pick a constant scaling factor between 0.0 and 1.0 and apply that to the correction. For example, suppose we pick 0.85 or 85% and N=3. With the above example, suppose the last 3 pilot corrections were all in the same direction, and the most recent one was +10*, and it was made 15 minutes after the prior one.:

  • The raw error being corrected is 10* / 15 minutes = 0.667* / minute.
  • Because N=3 we are 75% confident there is bias in this error, so shrink it to 75% of its value.
  • Apply our damping factor of 85%.
  • This makes the auto-correction factor 0.667 * .75 * .85 = 0.425* / minute
  • Apply this rate correction automatically going forward

Overall, we end up with a single pilot correction rate that is maintained in cumulative fashion. For example, in the last step above we don’t just set it to 0.425* / minute, but we add 0.425* / minute to whatever the existing value is. And repeat every time the pilot sets the gyro, so the value changes over time, adapting to varying conditions during flight.

Conclusion

This practical example is over-simplified but it illustrates the basic concepts involved regarding bias vs. variance in errors, how to differentiate them and make corrections, and how to increase our confidence that our attempt to reduce errors doesn’t unintentionally make them worse.

Twin Engine Airplanes

It’s common perception that twin engine airplanes are safer. Any for obvious reasons! Who wouldn’t want an extra engine? Yet the details give a more nuanced perspective.

With passenger jets, twin engines are definitely safer – no doubt about it. But with piston engine small aircraft (e.g. light twins), the safety record is more mixed. It boils down to 3 basic reasons:

  1. Having two engines doubles the likelihood of an engine failure.
  2. When one engine fails, the other produces differential thrust requiring immediate corrective action from the pilot to avoid loss of control.
  3. The single-engine performance of some piston twins is so marginal we sometimes say, “the remaining engine always has enough power to get you to the scene of the crash”.

Many people don’t really consider the first point, but when pointed out, it’s so obvious it doesn’t require further discussion.

Regarding point 2: engine failure in any airplane is an emergency, no matter how many engines it has. Yet with a single engine, the immediate pilot actions are pretty simple: keep the nose down so you don’t stall, and pitch for ideal glide speed. The engine is centered, so when it dies the airplane remains inherently stable and will keep gliding even hands-off. With twin engines, when one engine dies the other produces differential thrust that skews the airplane sideways and will flip it over if not corrected. This differential thrust is a double-whammy: the dead engine’s prop creates drag, pulling that side back, while the operating engine produces thrust, pulling the opposite side forward. Not only must the pilot keep the nose down to avoid stalling, but he must also apply heavy opposite rudder (not aileron) and feather the dead engine’s propeller to keep the airplane flying straight. If the pilot fails to do these actions quickly – within seconds – or does them incorrectly, the differential thrust can cause an uncontrollable spiral or spin.

Regarding point 3: one of the reasons people fly twins is for the superior payload and performance. You can carry heavier loads, and fly faster and higher. Yet if you are actually using that performance, you may operating in a way that cannot be supported by a single engine. So when one engine fails, even if you apply the correct inputs to keep flying, you may not be able to maintain level flight even with the good engine at full power.

Overall, the incident/accident statistics for light twins in general aviation is no better than single engine airplanes. Given this, why are big commercial jets always multi-engine for safety? Commercial aviation mitigates these factors:

  1. They use turbine engines, which are more reliable than pistons.
  2. The pilots are better trained, more frequently, and follow more strict operational limits set by both the FAA and their airline.
  3. The engines have much greater power than pistons, capable of maintaining level flight at high altitudes for extended periods of time, even when the airplane is at max weight.

In summary, light twin aircraft can be safer, or more dangerous, depending on the airplane, the pilot, and the mission or how the flight is operated. Pilots considering light twins should consider these limitations, how the airlines mitigate them, and incorporate that into their flying. For example:

  1. Maintain the aircraft above & beyond required minimums.
  2. Train yourself well beyond the required minimums, stay current.
  3. Don’t load to max weight, and fly missions that give you a healthy safety margin below the aircraft’s max performance.

Even then, in my opinion light twins are not safer and the higher performance is not worth the expense and hassles of the higher cost of fuel, maintenance, insurance and training. Speed is proportional to power cubed and drag is proportional to speed squared, so all else equal a twin burns 59% more fuel to go 26% faster.

Here’s where those figures come from:

  • The cube root of 2 is 1.26, so twice the power is 1.26 times as fast.
  • Drag is proportional to the square of speed, and 1.26 squared is 1.59.
  • Fuel consumption is proportional to drag.

Flying VFR International

I fly to Canada occasionally and I haven’t gotten fined or arrested, nor even admonished, so I must not have done anything too terribly wrong. This isn’t covered in private pilot training, so I figured it might be helpful to share my checklists. Note: this is for VFR.

Planning (weeks ahead)

  • Passports for every person on board
  • Buy US Customs sticker and apply on pilot side airplane door
  • Create an EAPIS account
  • Have a 3rd or higher class medical (BasicMed not allowed in Canada)
  • Proof of airplane insurance (required in Canada)
  • Radio station & operator license (legally required but nobody ever asks for it)
  • Get Canadian CFS (their AFD book) and charts
  • Proof of COVID vaccination for every person on board
    • COVID tests not required as of March 2022

Pre-Flight (1-2 days ahead)

  • File EAPIS including all people on board, print and bring the email confirmation
  • Pick an Airport of entry for your first landing after crossing the border
  • Figure out where Customs is at your airport of entry (airport diagram, etc.)
  • Call customs at your airport of entry 2-48 hours before landing
  • File international flight plan in the country you’re departing
  • If in Canada returning to the US, call Flight Service an hour before your flight to get your border crossing squawk code

In-Flight

  • Before crossing border, ensure your international flight plan is activated and you are squawking a discrete border crossing code
    • In USA, when in-flight radio flight service 122.2 or nearby RCO to activate
    • In Canada, call flight service 1 hour before departing to file plan & get squawk
    • Don’t cross a border squawking VFR
  • Fly the plan to your destination airport of entry

Flying into Canada

  • Before entering Canada, contact Canadian approach or terminal
    • for example Victoria Terminal 127.8
  • In all Canadian radio communications, emphasize the “N” at the start of your tail number
  • After landing, taxi to Customs, stay inside your airplane and call Canada customs
  • They will usually clear you over the phone without an in-person visit

After flying in Canada, they will mail you a bill for ATC services. The bill has a flat calendar quarterly rate for every quarter in which you fly in Canadian airspace. For example in 2023 I flew to Canada twice, in July and August, and both trips happened to fall in the same quarter. I got a bill for $24.09.

Canada aviation regulations and procedures are similar to the US, though here are a few key differences that will help keep you out of trouble:

  • VFR flight plan required for all flights > 25 nm
    • Call to file before flight
    • Plan automatically activates at filed start time – no need to activate after takeoff
    • Must call to close plan upon landing
  • At busy airports, call clearance delivery before calling ground (even for VFR), to get your taxi/takeoff clearance and squawk code, if applicable.
  • Altitude: 10,000 – 13,000 limited to 30 mins without oxygen
  • VFR over the top is restricted
  • VFR night is restricted
  • MF: mandatory frequency; like CTAF
  • Class “E” airports (untowered) have mandatory reporting before entering their airspace
  • Monitor 126.7 continuously, en route, and make occasional position reports in the blind. Also monitored by FSS.
  • Contacts

An ADS-B Troubleshooting Saga

Introduction

ADS-B is “Automatic Dependent Surveillance Broadcast”. It is an electronic system installed on airplanes that reports their 3-D position in real time. The FAA required all aircraft flying in controlled airspace to have ADS-B by Jan 1, 2020.

My ADS-B system is uAvionix Tailbeacon TSO. I installed it in Oct 2019 and it worked well for about 3 years.

Back in March 2023 I was flying back to KBFI when the tower controller said she didn’t have my Mode C altitude. This sometimes happens even when the transponder is working well, so I reset it. I also reset the Tailbeacon ADS-B just to be safe. The controller then asked if I was ADS-B equipped. This is never good, since it means they aren’t getting my ADS-B data.

The Saga Begins

The next day, a technical representative from the FAA emailed me to tell me my airplane’s ADS-B system wasn’t working, and asked how I plan to fix it. He also provided performance reports from recent flights to show that it was not an isolated case, but a trend. I opened a support case with uAvionix and notified my local airplane shop. My airplane was about to go in for its annual inspection, so I said I’d have them fix during that time. Until then, I self-grounded for a couple of weeks.

When I flew from KBFI to KPLU to drop my airplane off for its annual, the ADS-B performance report (PAPR) was clean. So the Tailbeacon did work properly under some conditions.

Death from Corrosion and Ground Wiring

During the annual, based on uAvionix advice, we improved the fin grounding by running a wire across the hinge to the rudder. We found corrosion on the Tailbeacon circuit board so uAvionix said it should be replaced. Since it was beyond its 2 year warranty, they asked for $400 for the replacement, which is an 80% discount. I asked for a courtesy replacement due to all time, expense, and down-time the failure was causing me. uAvionix granted that and sent it for free.

After annual, the new Tailbeacon worked well enough that ATC did not complain, but it still failed the PAPR. All the data was correct, but the GPS quality flag (NIC) sometimes dropped below minimum required accuracy.

GPS problems are common enough with Tailbeacon that uAvionix has a detailed 16 page manual to troubleshoot it. They sent me a copy. It is marked “company confidential – do not distribute”, so I won’t post it here.

The FAA PAPR is just a summary telling you whether you passed, and if you didn’t why you failed. So if you fail, you know why but you don’t know exactly where. You can email the FAA and they will provide a detailed GPS log in KMZ format, showing every message your ADS-B system sent, color coded GREEN for good and RED for bad. This is essential for troubleshooting ADS-B systems. You can load this into Google Earth and easily see exactly where it failed.

Radio Interference

In the detailed track log, it was mostly green, but red in a few spots. I noticed that one of the spots it turned red was over the rock quarry SE of Boeing Field, exactly where Boeing Tower asked me to report my position. Could my radio transmission have jammed the Tailbeacon GPS? It seemed unlikely because I was transmitting on 118.3 MHz, while GPS is at 1.5 GHz, more than 10x higher frequency.

The uAvionix troubleshooting doc says that radios can jam the GPS from harmonic distortion. Specifically, around the 12th or 13th harmonic. When this happens, you can install lowpass filters on the comm antennas to block that distortion. But those lowpass filters are expensive, and the GPS track also turned red in places I wasn’t transmitting, so I wasn’t sure if that was the problem.

I have 2 comm radios, an MX-385 and an RT-385. I removed one from the panel and made a test flight. Then I reinstalled it, removed the other, and made another test flight. The PAPR for these flights still failed, but it improved. With the MX-385 removed, there were fewer GPS drops.

Next, I tested it on the ground. I turned on the Tailbeacon while monitoring its data with the uAvionix app on my phone. I watched it get a good GPS fix. Then I transmitted on different frequencies on each of my radios. The MX-385 would cause the Tailbeacon to lose GPS completely and instantly. The RT-385 did not. But it would jam the GPS while flying. So ground testing is informative yet not authoritative.  I also made test flights with the Emergency Locator Transmitter (ELT) turned off and antenna disconnected.

So I needed to install filters. But what kind? From what I read, Garmin makes them and so does TED. The TED filters are more than twice the price, but user comments suggested they are more effective. The TED 4-70 is -52 dB at 1.5 GHz. I ordered 2 of them.

The filters should be easy to install: each goes inline and has a BNC connector on each side (one male, one female). So I crawled underneath my airplane panel with a flashlight. I discovered that the comm radio antennas do not have any BNC connectors. They are hard-wired to the back of the radio rack, and the cable runs straight to the antennas on the roof of the airplane. I spent hours removing interior panels to follow those cables looking for a connector, but alas there were none. So the only way I could install the filters was to cut the antenna cables and install new BNC connectors.

I studied to find out what kind of coax cable the antennas use, ordered a set of male and female BNC connectors, a cable stripper, and crimp tool. When they arrived I spent several more hours contorted upside-down under the panel with a flashlight, cutting the cables and installing the connectors. When I finished I ground-tested the radios. One worked, the other didn’t. Apparently, a strand of wire went astray when I installed the BNC connectors. So I did it over again. Finally, both radios worked.

I made a test flight and the PAPR was much improved. The GPS NIC never dropped to zero, but only dropped to 6. It should be in the range of 7-9. So it still failed, but it nearly passed.

I bought another pair of TED 4-70 filters, this time used from eBay to save money. I installed one on the ELT antenna and kept the last as a spare. My next flight still failed the PAPR, but it was still improved.

Switches and Connectors

I mentioned that my flight from KBFI to KPLU with the old Tailbeacon pass the PAPR. Just before that flight I exercised the panel switch for the Tailbeacon about 10 times, to scrape off any internal corrosion and improve the connection. These panel switches are OEM, so they are over 40 years old. I exercised all of them again to see if that would help.

Well, three of them broke while I was switching them back and forth! At home, I wired a shunt from 16 gauge wire with dual male spades, soldered together. Then at the airplane I plugged the nav light direct through the shunt instead of through the switch. The next test flight still failed, but almost passed, a further improvement and closest I had yet come to passing.

Re-Evaluation

At this point I had done everything in the uAvionix guide, and it still wasn’t passing the PAPR. It was working well enough that ATC was not complaining. But it needed to pass the 91.227 requirements, which are more strict.

uAvionix escalated my case to Lou and we spoke for about an hour covering the history, all the things I had tried, and what to do next. We agreed that I would replace the panel switches in my airplane, test it again. If it didn’t pass, uAvionix would send me another warranty replacement unit. But Lou said they were out of stock and it would take 4 weeks.

So, I dropped my plane at Spencer Avionics to get the switches replaced. Spanaflight had new switches in stock and Spencer installed them. My next flight worked as well as the prior one with the shunt, so the new switches definitely helped. And I needed them anyway, since some broke. But it still didn’t pass.

At this point Lou called me and said that even though uAvionix was out of stock, he had one at his avionics shop and he would send me one, via 2 day FedEx.

Another Warranty Replacement

When it arrived I flew back down to Spanaflight and, working alongside Karl, we replaced the old Tailbeacon with the new one. At my request we soldered it instead of using crimp connectors. I turned it on and did the initial set-up. Then on my flight back to KBFI I flew the long way around in order to make the flight long enough (at least 30 mins) to get PAPR. After I landed, I pulled the report and it passed! I forwarded it to the FAA rep, who agreed it passed. Problem solved, case closed.

Happy Ending

So that is the end of the saga. Here’s a summary:

  • Original Tailbeacon developed corrosion on its circuit board, after 3 years of service.
  • It failed intermittently especially in freezing temperatures.
  • The new warranty replacement Tailbeacon also failed, due to weak GPS (low NIC).
  • All other fields (tail #, squawk code, etc.) were correct. The only failure was NIC.
  • We improved the ground by wiring across the hinge from the rudder to fin. This improved things but didn’t fix it.
  • We installed notch/lowpass filters on both comm radios and the ELT. This improved things but didn’t fix it.
  • We replaced the panel switches to the nav light. This improved things but didn’t fix it.
  • We replaced that Tailbeacon unit again, with another new warranty replacement.
  • During installation we soldered it instead of using the crimp connector. And we covered the connection with insulating shrink wrap.
  • The new Tailbeacon passed the PAPR on the very first flight and the FAA representative signed it off.

If this new one had failed, my only other option would have been to stop using uAvionix Tailbeacon and install a Garmin GDL-82 system instead.

Airplane Engines

Introduction

Most small airplanes are powered by piston engines. Car engines are sometimes used for kit or experimental airplanes. It seems like a logical thing to do since most car engines are reliable and less expensive than aviation engines. Yet while some car engines have performed well in aviation, they are the exception that proves the general rule to the contrary.

Here I’ll discuss some of the important ways in which airplane engines are different from car engines.

Rotational Speed

A typical prop for a small airplane has about a 76″ diameter (more or less). That’s a circumference of about 20′, which is how far the tips move in each revolution. The speed of sound is about 1100′ per second (sea level standard conditions), so that’s 55 revolutions per second, which means at 3,300 RPM the tips of the prop are moving at the speed of sound.

When the tips move faster than about 85% of the speed of sound, they start to lose efficiency. The airflow changes and they start making more noise & turbulence, and less thrust. And it creates unnecessary stress on the prop. So we need to limit the prop to about 2800 RPM. But we need to limit a bit more than that, because the airplane flies at high altitude where air is colder and sound travels slower. So typical small airplanes like this have a prop redline of 2700 RPM, plus or minus (lower for bigger props).

Power moves the car, or the airplane, or anything else that moves. In an engine, power is torque * rotational speed. Cars have a transmission enabling the engine and wheels to spin at different speeds, so they can rev up the engine to make good power, then gear it down to the wheels to maximize performance. To avoid the complexity, weight and reliability issues of a geared engine, in most airplanes the prop is bolted directly to the engine crankshaft. Thus, limiting the engine to 2700 RPM limits the power it can produce.

Consequently, most aviation engines don’t make much power for their displacement (for example the popular Lycoming O-360 which makes 180 HP from 360 ci), but they are designed to produce their rated power continuously while being lightweight and reliable.

Duty Cycle

Cars spend a lot of time in traffic constantly changing speeds. And cars rarely use their full rated power, but spend most of their time producing only a small part of it. For example, it takes about 30 HP to move a typical car down the freeway at 60-70 mph. For a car with a 150 HP engine, that’s only 20% of its rated power. A car engine is optimized for this duty cycle: to be efficient and reliable while producing a low % of its rated power.

Airplanes spend most of their time in cruise flight moving at a constant speed. The engine is running at a constant speed at or near wide open throttle, producing a high percentage of its rated power. For example, cruising at 70% power is typical. Airplane engines are designed to operate efficiently and reliably while generating their full rated power.

Lightweight

The value of light weight in an airplane engine is obvious. Consider the Lycoming O-360 mentioned above. It is a large displacement 360 ci engine that weighs only 260 lbs. A typical car engine of similar displacement weighs more than twice as much.

Of course, that 360 ci car engine would produce more than 180 HP. So for a fair comparison consider a modern car engine making 180 HP, like the Mazda Skyactiv 2.5. It produces 180 HP and weighs 260 lbs. In power and weight it’s similar to the Lycoming. But that Mazda is not designed to produce its rated power continuously. If you ran it constantly at wide open throttle at 6000 RPM it would not last very long.

It’s not easy to produce a lightweight engine that can operate reliably while continuously producing its full rated power. From a power / weight / reliability perspective, the Lycoming O-360 is comparable to modern car engines in 2022. This is especially notable when one considers that the Lycoming is a design from the 1950s.

Efficiency

Modern car engines are fully computer controlled. The driver applies a certain amount of throttle, and the engine computer determines the valve timing, spark timing, air/fuel ratio, etc. and constantly changes or adapts these settings to the conditions.

Airplane engines are manual. The pilot sets the throttle, RPM, and mixture manually. How can a human compete with a computer? Pretty well, it turns out, because the airplane spends most of its time in cruise flight, running at a constant power level, RPM, and altitude. This gives the pilot time to carefully optimize these settings and leave them there for hours.

One way to measure efficiency is miles per gallon. That Mazda gets about 40 miles per gallon on the freeway. A Cessna 172 in cruise gets about 18 miles per gallon. The Mazda wins, right? Well, it’s not really a fair comparison because the Cessna is going twice as fast. If you drive that Mazda twice as fast (say 130 miles per hour), it’s going to get about 1/4 the fuel economy, which is 10 miles per gallon (or less). So at the same speed, the airplane is almost twice as efficient. Indeed, other airplanes like Mooneys are far more efficient than the Cessna.

Yet this method of measuring efficiency is more about air resistance or drag, than the engine. Airplanes are just inherently more efficient than cars. What if we ignore that and focus on the engine itself?

Another way to measure efficiency is BSFC: brake-specific fuel consumption. That is, how much fuel does the engine consume to do a certain amount of work? One way to measure this is horsepower per gallons per hour.

Let’s estimate this for the Mazda. Suppose it’s getting 40 miles per gallon at 65 miles per hour. Each hour it burns 65/40 = 1.625 gallons of gas. Traveling that fast takes about 30 horsepower, so it produces 30 / 1.625 = 18.46 HP per gallon per hour.

Now consider the Cessna 172. It’s getting 18 miles per gallon at 130 miles per hour. Each hour it burns 130/18 = 7.2 gallons of gas. But how much horsepower is it generating? That is about 65% power, which is .65 * 180 = 117 horsepower. It produces 117 / 7.2 = 16.25 HP per gallon per hour.

So here the Mazda engine is about 13% more efficient (18.46 versus 16.25). However, keep in mind that this is when producing only 30 / 180 = 17% of its rated power. The Lycoming was producing 65% of its rated power. When you open the throttle to make the Mazda produce 65% of its rated power, its efficiency drops significantly, well below the Lycoming.

Note that each engine, car or airplane, is more efficient than the other when operating within its typical duty cycle.

Reliability and Durability

If an aircraft engine fails in flight, the airplane stays in the air but not for long; it becomes a glider that is going to land somewhere very nearby, very soon (within minutes), and most likely off-airport. It is an emergency situation that can lead to injury or death. If a car engine fails, you coast down and simply pull over to the side of the road. It’s an inconvenience, not an emergency.

Airplane engines are designed for reliability. Their spark plugs are powered by magnetos, so (unlike a car) the engine keeps running even if the electrical system fails. Each piston has 2 spark plugs, so if one fails, the piston still produces power. They have 2 separate magnetos and half the plugs are fired by one magneto, half by the other, so if one magneto fails, the engine keeps running. They are air cooled, so there is no water pump that can fail, no radiator that can leak. Also, they spend most of their time in cruise operating around 2500 RPM, so they have static spark timing optimized for that speed – no need for timing advance means simplicity and reliability.

Plenty of historical examples demonstrate the problems using car engines in airplanes. In the 1980s, Mooney made a plane that was optionally powered by a Porsche engine. It had so many problems, the changes needed to make that engine reliable in aviation were so extensive, Porsche gave up and discontinued it. Thielert had a similar situation building Mercedes diesel engines for aviation use. You can google the details on these and other examples.

Yet how do we reconcile this history with the fact that aviation engines use technology that is more than half a century old? A pilot’s pet nickname for Lycoming is “Lycosaurus”!

Consider how any engine becomes reliable: start with a good design, then tweak a little it every year to address any problems discovered in the field. Cars follow this pattern. They come out with a new engine, the first year has some issues, each year it gets a little better, then 5-10 years down the road, just when the engine is reaching its peak, they scrap it and start all over with a new design incorporating new technology. Imagine how reliable car engines would be if they never scrapped it, stuck with the design and continued that incremental improvement for 50 years. The engine would be “low tech” for sure. And may not be as efficient. But reliable? You betcha – they’ve seen just about every failure there is and incorporated changes to address it.

This is what a typical Lycoming or Continental certified aircraft engine is: the result of more than 50 years of incremental improvement on a design that was pretty good to begin with. It’s ancient technology, yet it’s highly optimized and adapted in an incremental, evolutionary way.

Production

Last year, Mazda built more than half a million engines. Lycoming produced about 4,000 engines. Yet this difference of more than 100:1 understates the difference, because there are many car manufacturers while there are only two manufacturers of certified aircraft engines: Lycoming and Continental. For each aircraft engine built, more than 1,000 car engines are built.

To produce reliable engines at such low volumes, aircraft engine manufacturers use completely different production methods. Each engine and all the parts in it are individually hand-built, inspected, and tested before leaving the factory. Visit a modern car engine factory and it looks like a scene from a sci-fi movie where robots have taken over the world. Visit an aviation engine factory and it looks like you’ve gone back in time to a boutique hot rod custom engine building company.

Conclusion

Cars and airplanes are completely different applications with different requirements. It should be no surprise that engines optimized for one are not well suited to the other. High technology is not and end, it is a means to an end. The end or goal is meeting the requirements for the application. Pilots building their own kit / experimental airplanes can use any engine they want. Yet most of them still prefer certified aviation engines from Lycoming or Continental, despite the high cost and low technology compared to car engines. This is not irrational, but backed by some of the reasons discussed above.

All that said, much of the reason aviation engines are so low tech and expensive, is certification. The cost to certify an aircraft engine is so high, and production volume is so low, they can never break even on a new engine design. Over the years, this forced them to differentiate and improve their products with incremental tweaks to existing designs. One can view this as an unintended consequence of over-regulation: certification rules that were intended to promote safety, led to technological stagnation. Or, one can view it as a beneficial outcome that optimizes for reliability in their intended application, which is crucially important with aircraft engines.
WRIAD: White Rim in a Day

Summary

The White Rim Trail is SW of Moab Utah. It follows the Colorado River SW to its junction with the Green River, then NW up the Green River, making a rough “V” shape, then a mix of dirt & paved roads connect the top of the V. It makes a loop measuring 100 miles, about 8000′ of cumulative climb. The trail ranges from simple dirt/rock, to sand, to rugged steep technical with big rocks. Along the route there is no food, water or services. And mostly no cell/mobile coverage.

Most bicycle tours take 3-4 days to do this trail, supported with 4WD vehicles providing food, water and shelter. It is possible to ride it in a single day, but it’s a big physical effort that also takes some planning. It helps to have a gung-ho friend named Stefan to convince you to ride it with him.

Stefan rode WRIAD solo in Oct 2020, and he and I rode it together in Oct 2022. This describes what it was like and how we prepared for it.

Pics here: http://mclements.net/Moab-202210/

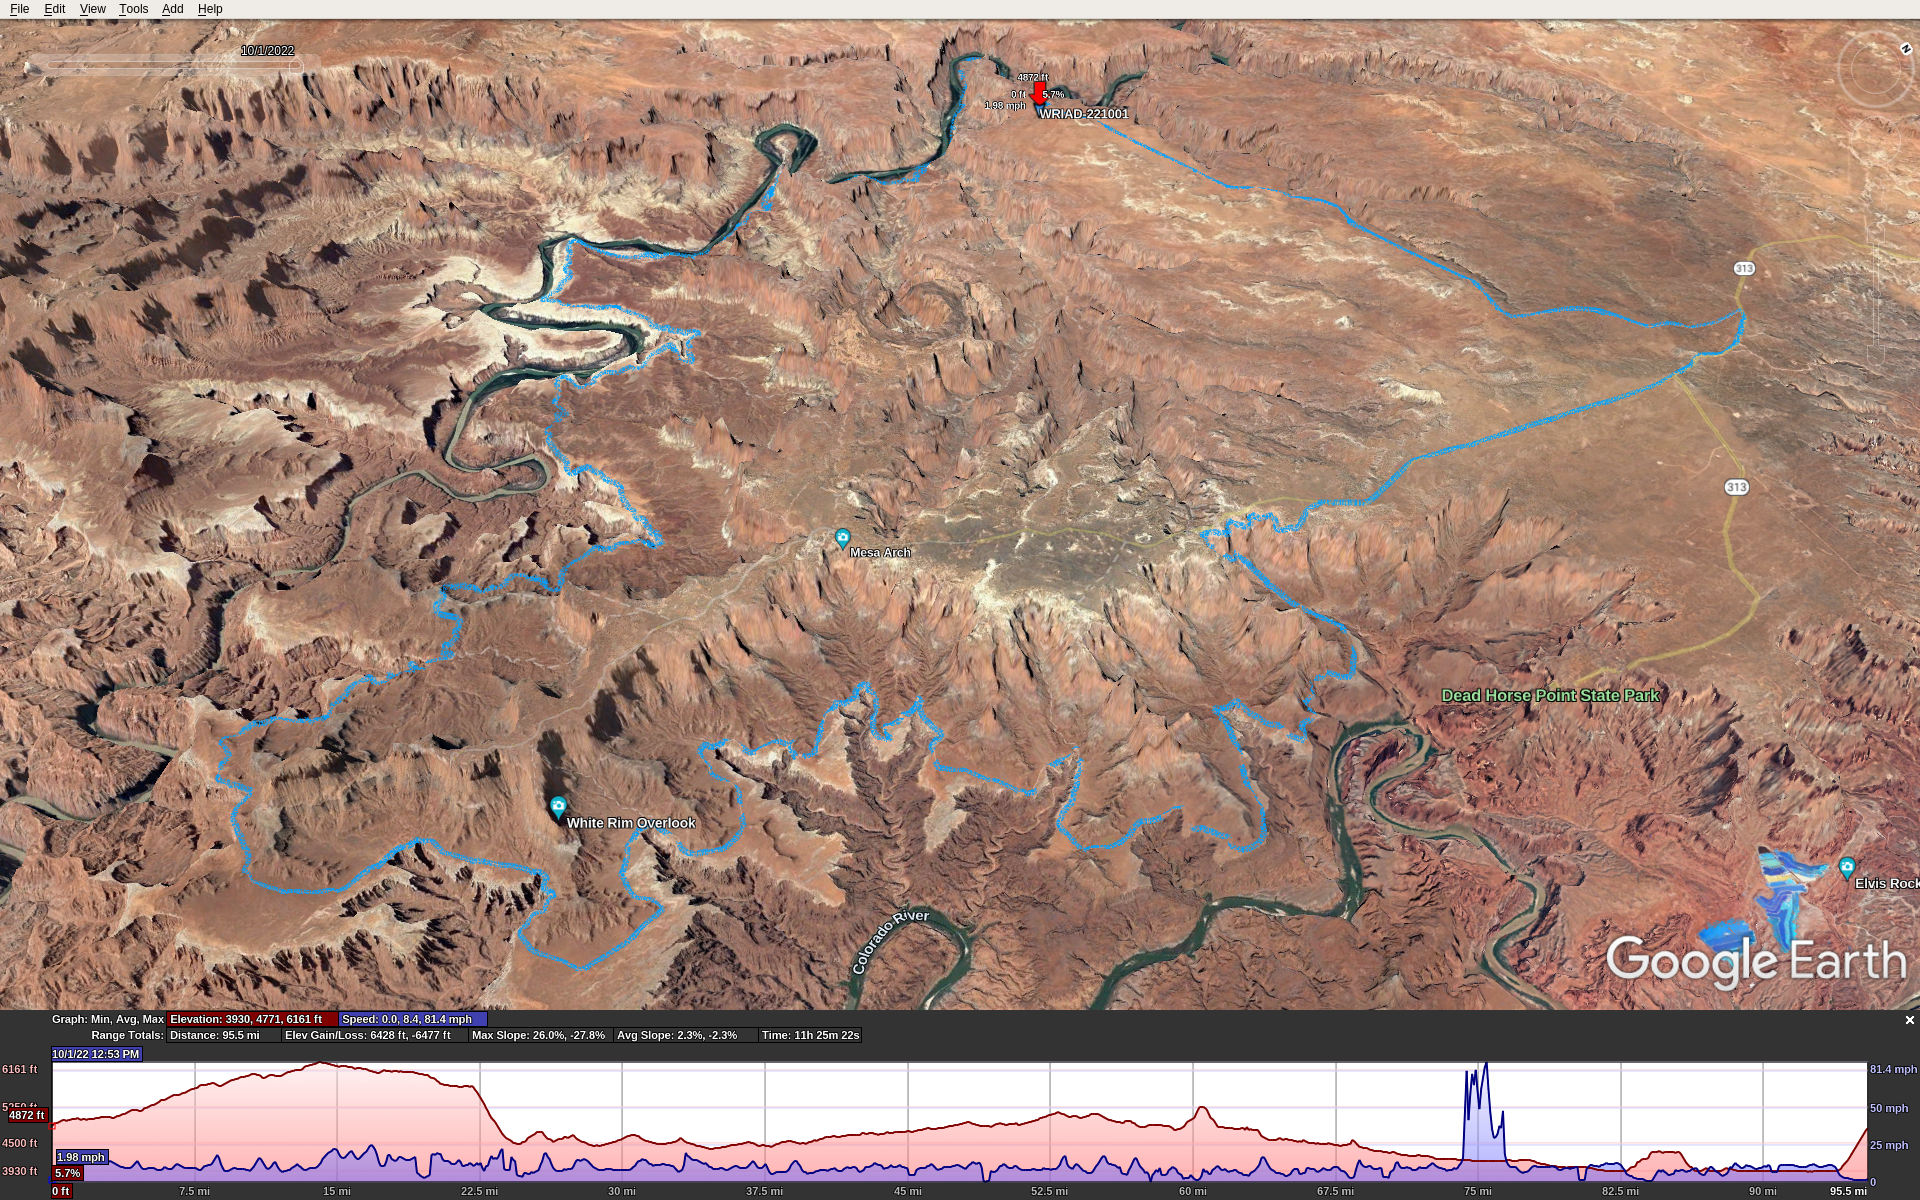
Here’s the GPX track overlaid with Google Earth, which underestimates the mileage and elevation because it over-smooths and simplifies the track. The red flag is our start/end point. The spike in speed around mile 75 is a GPS glitch.

Preparation

I’ve done some big tough MTB rides over the years. La Ruta, Kokopelli’s Trail, OTGG, and others of Stefan’s and my own devising. From a fitness perspective I knew what to expect. It takes several months to a year of serious training to get into the best physical fitness you can. You’re going to be pedaling for 10-12 hours over rugged terrain, miles of tire-sucking sand, and incredibly steep grades (> 25%) that make its 100 miles feel more like a 200 mile road ride.

The best time to ride WRIAD is in spring or fall. This means near the equinox, so you’ll have about 12 hours of daylight.

You need a day-use permit that you can get a day or two in advance, cost about $6. And you need to pay another $15 to enter the national park.

Plan on 11-12 hours total if you stop only once or twice during the ride. That means enough food and water to carry you through. Everyone is different; here’s what worked for me. I had 224 ounces of water: two 100 oz camelback bladders, plus a 24 oz. water bottle. I used all but 12 ounces of it. For food, bring some real food for lunch (sandwich, burrito, etc.) and about 240 cals per hour to eat while you’re riding. Have this food ready to eat while riding because if you stop to eat every hour, you might not finish the ride in daylight.

Have a bike that you trust, proven to stand abuse. A bike mechanical failure that strands you along the trail can keep you there overnight and become a life threatening situation. Make sure the entire drivetrain, axles, etc. are new and fresh. Several sections of the trail are too rugged for a gravel bike. You will need a true mountain bike, hard-tail or full suspension, with knobby or semi-knobby tires at least 2″ or 50mm wide. I used Maxxis Ardent Race, 2.2″ / 57mm and they were great. Anything narrower wouldn’t work, anything wider would make a hard ride even harder.

Clockwise or Counterclockwise?

This is a common question. Both ways are doable. Either way you go, you’ll descend into the canyon then climb back out again. These two points are Shafer on the NE side and Mineral Bottom on the NW side.

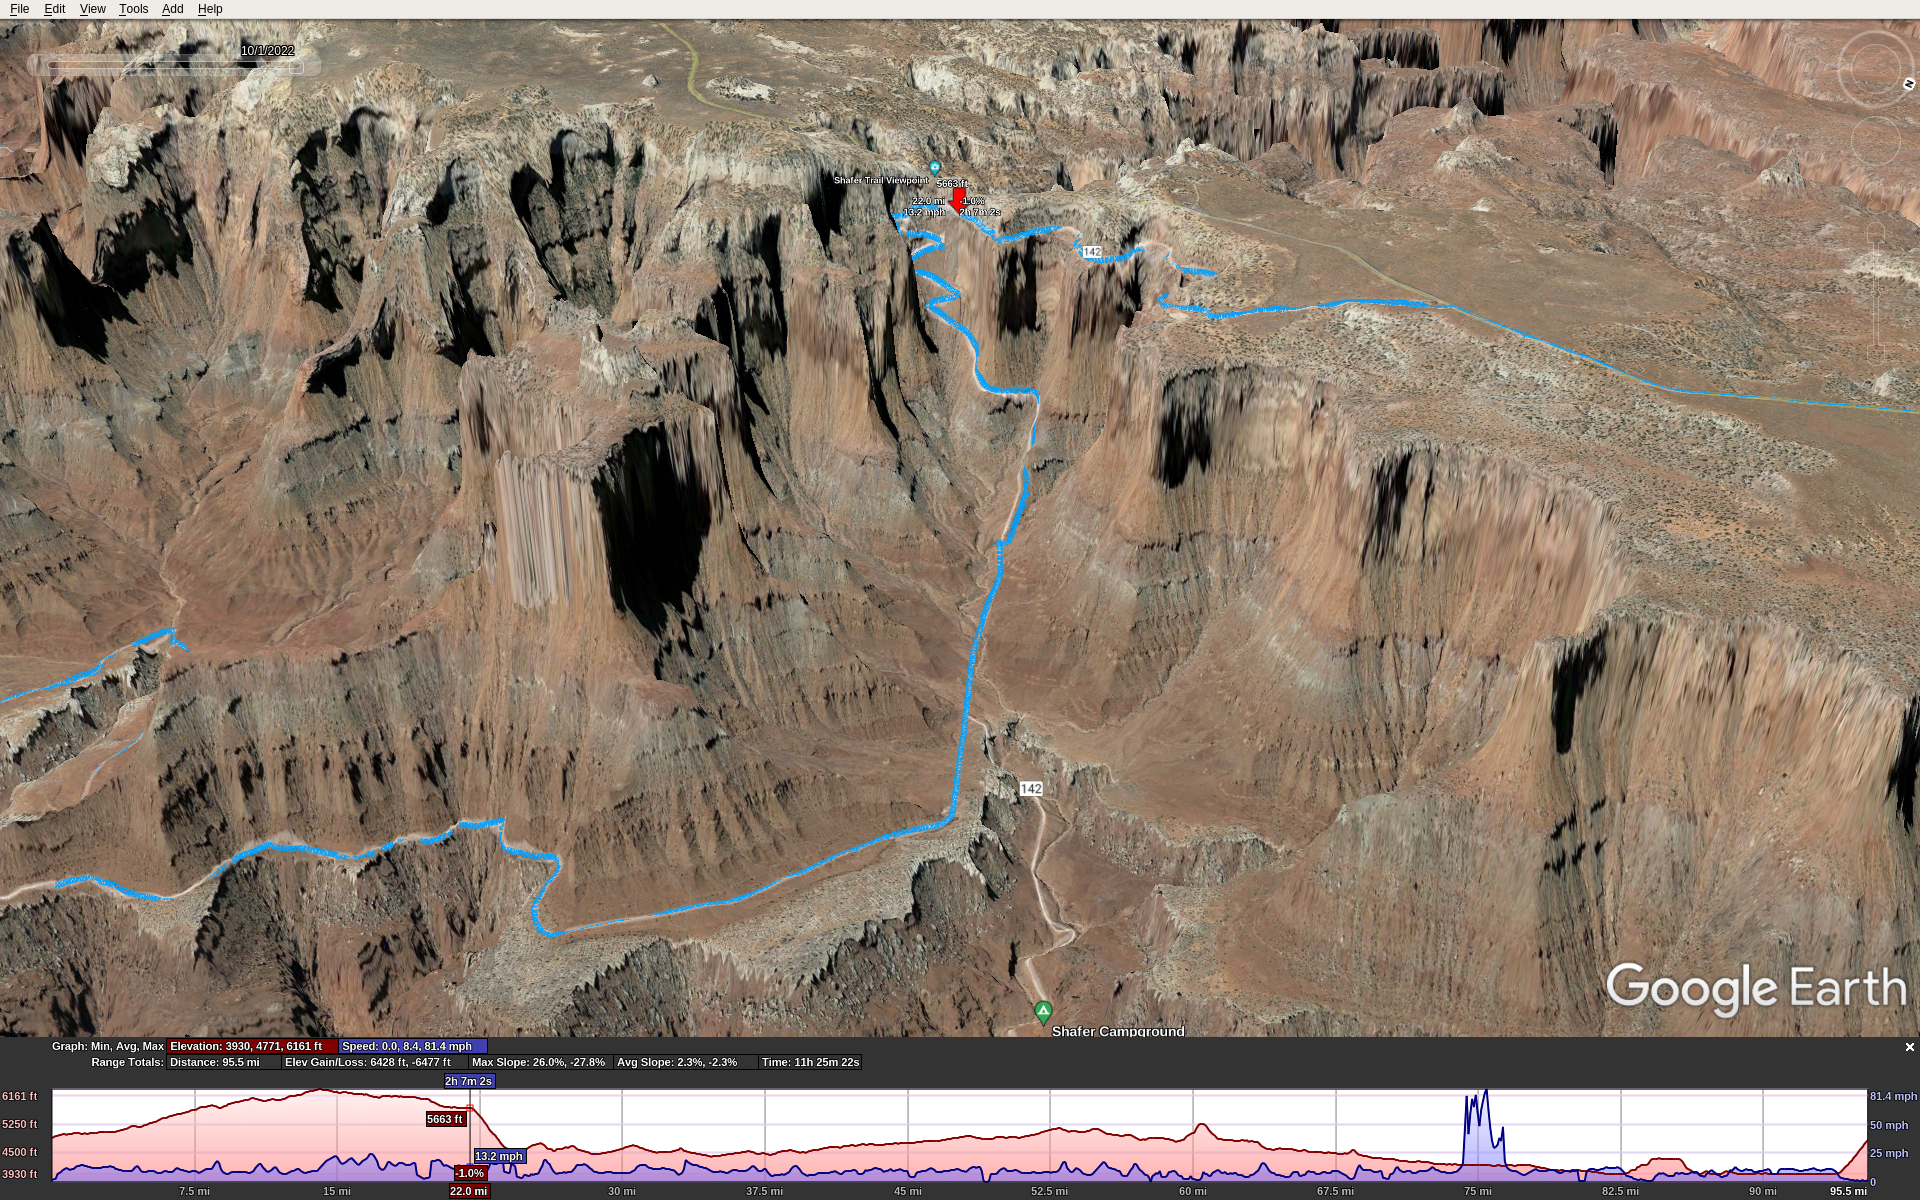
Here’s the Shafer grade. Red marker is poised at the top.

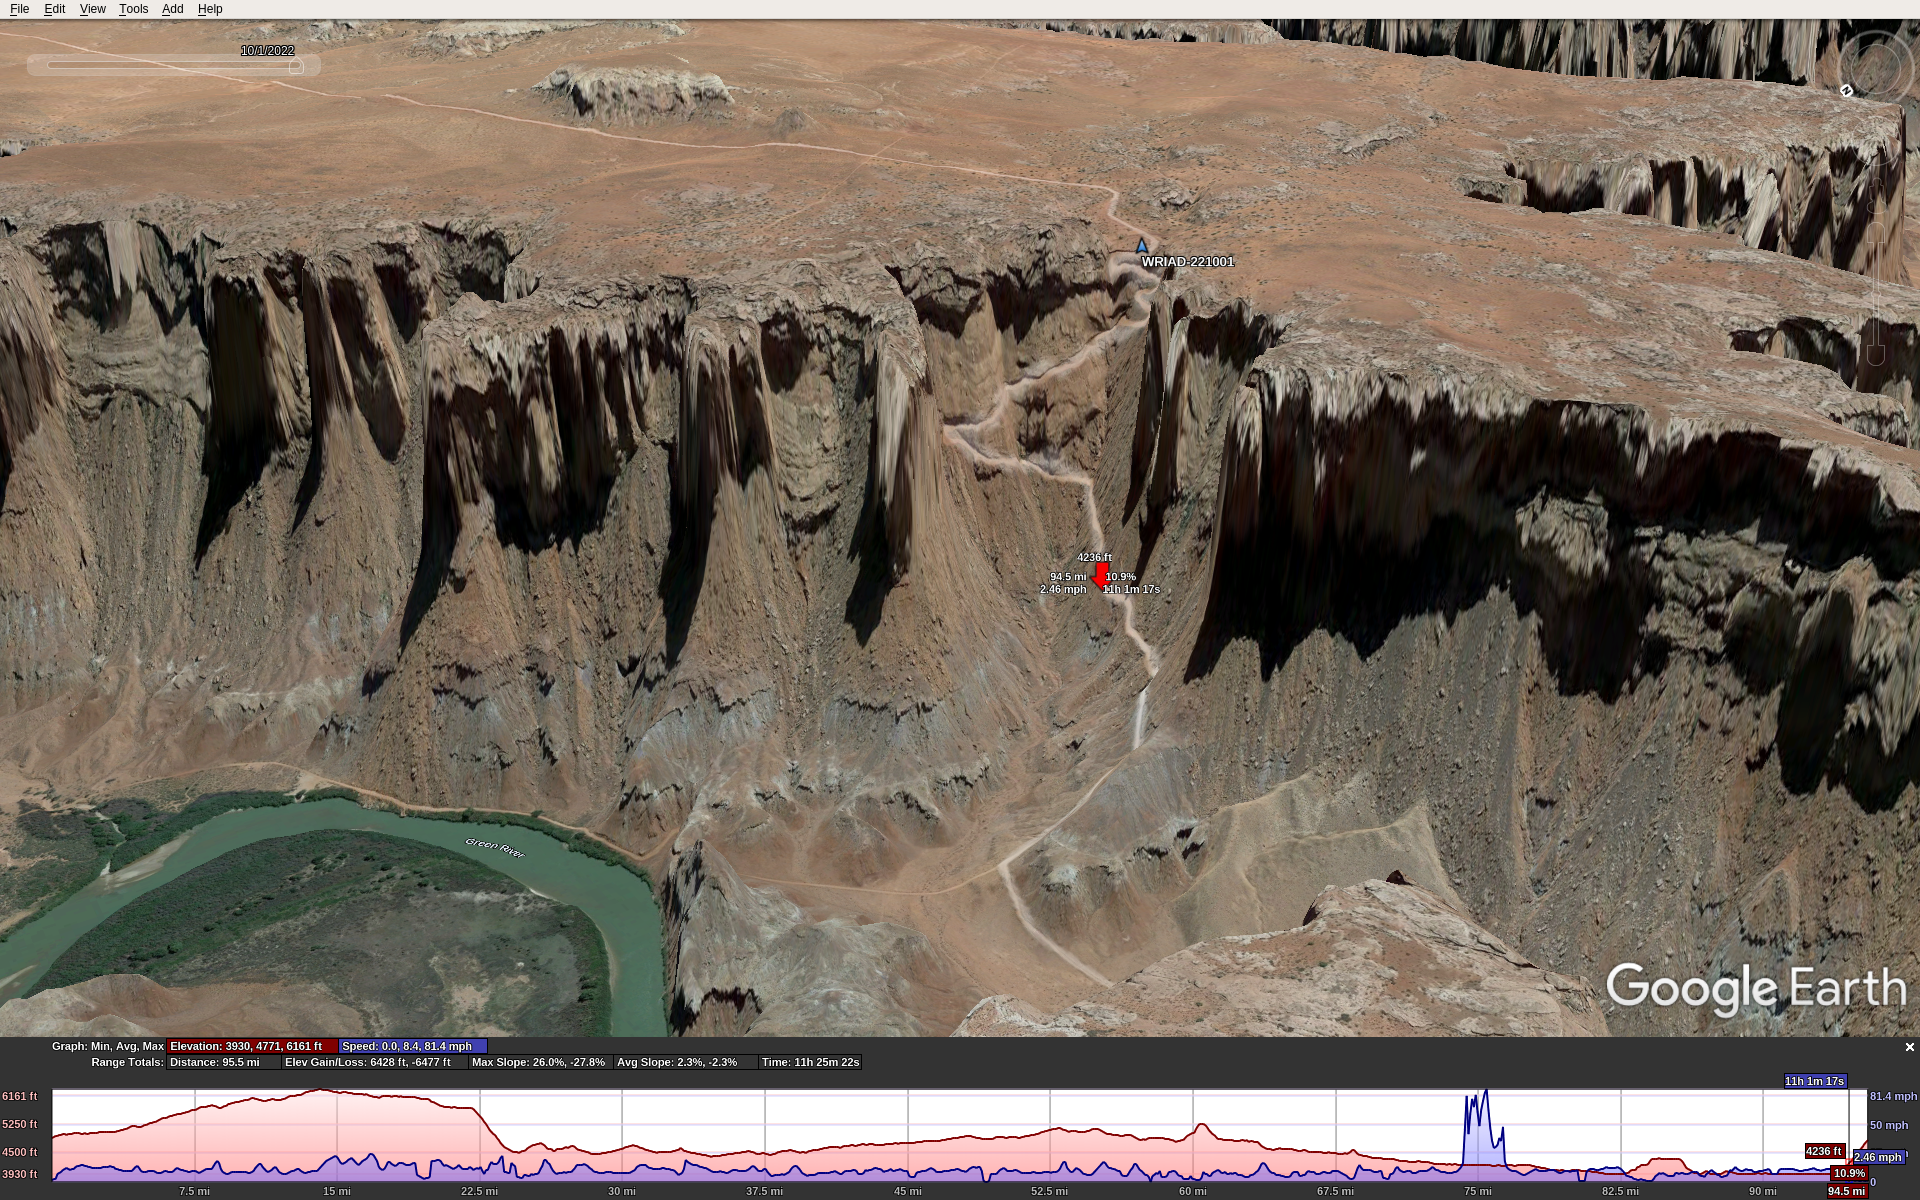
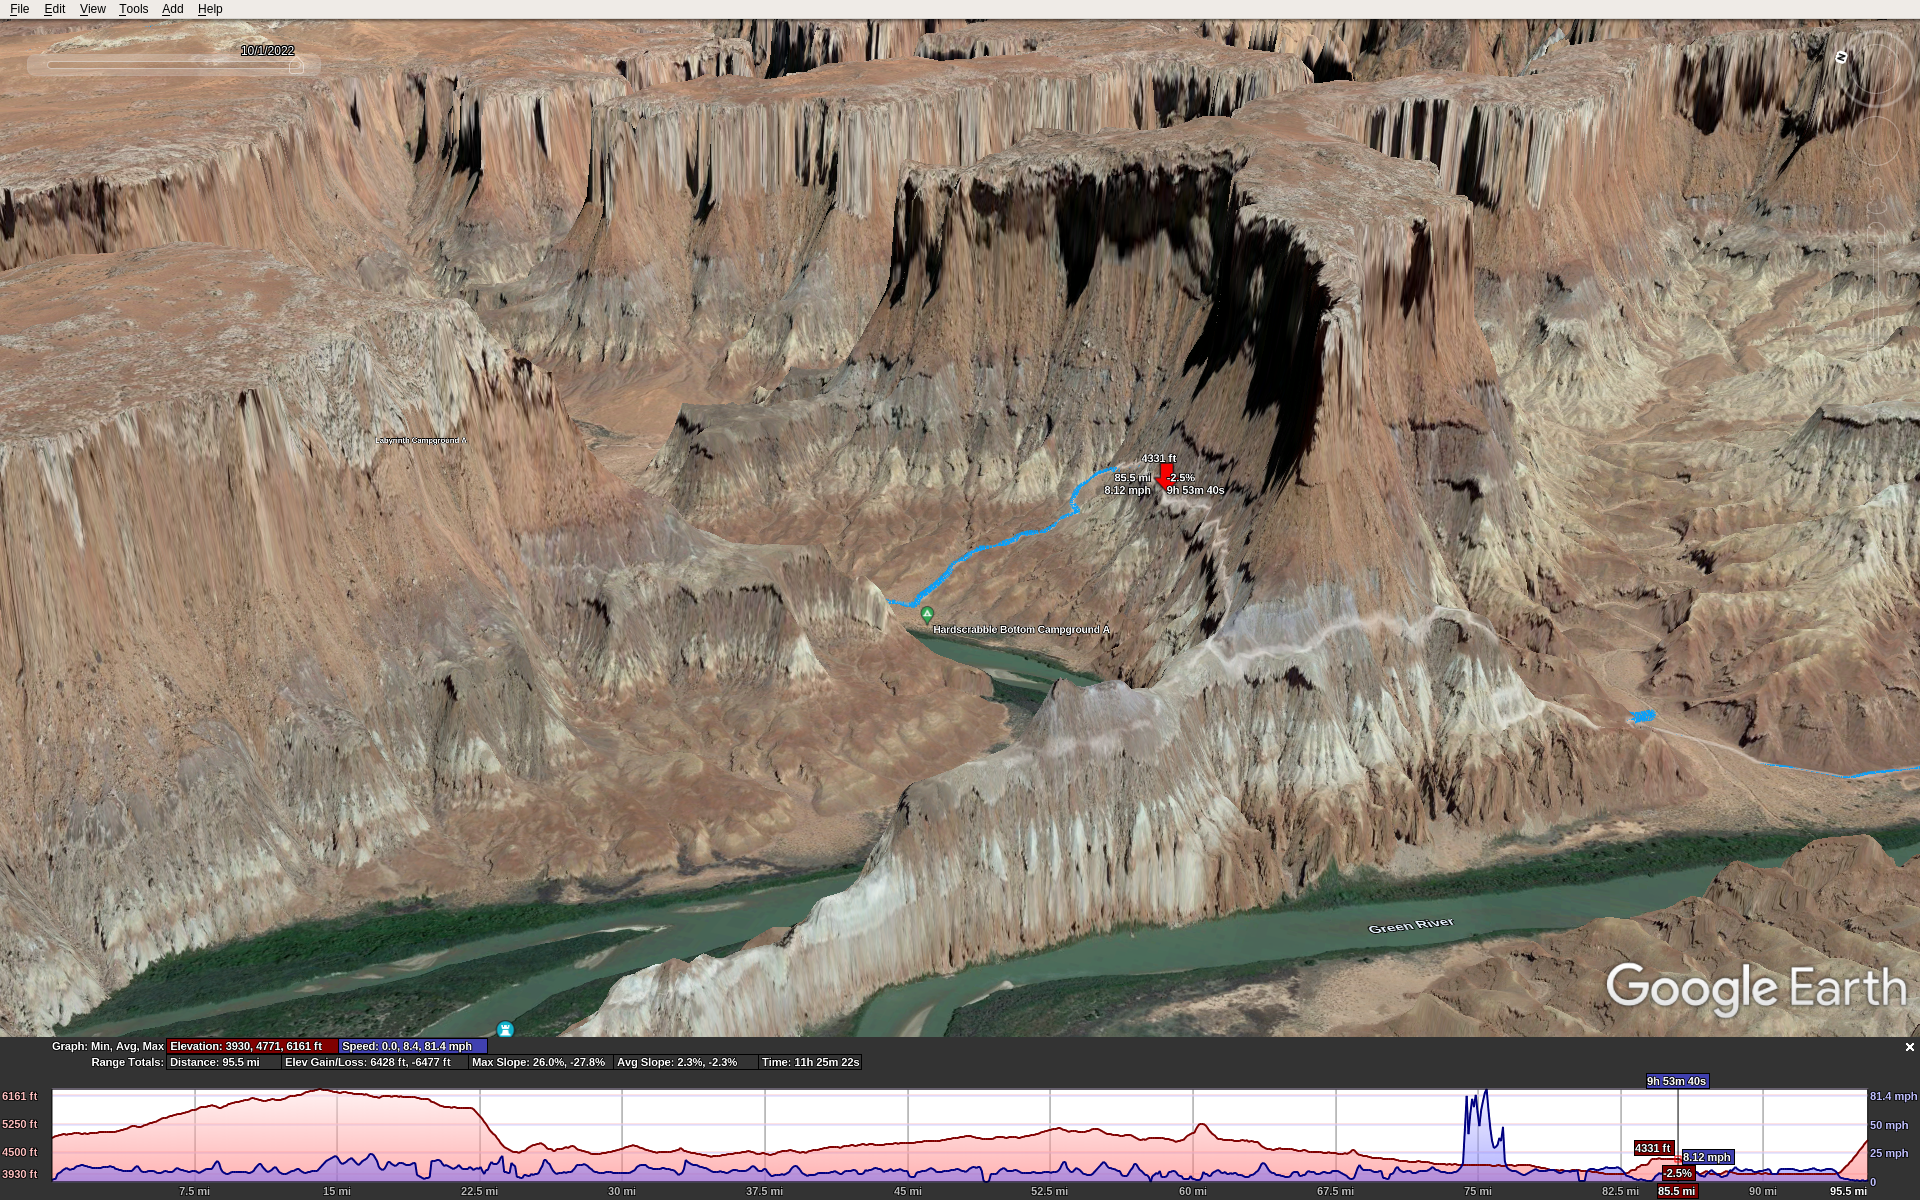
Here’s the Mineral Bottom grade. Red marker is half-way up, blue marker is our start/end point.

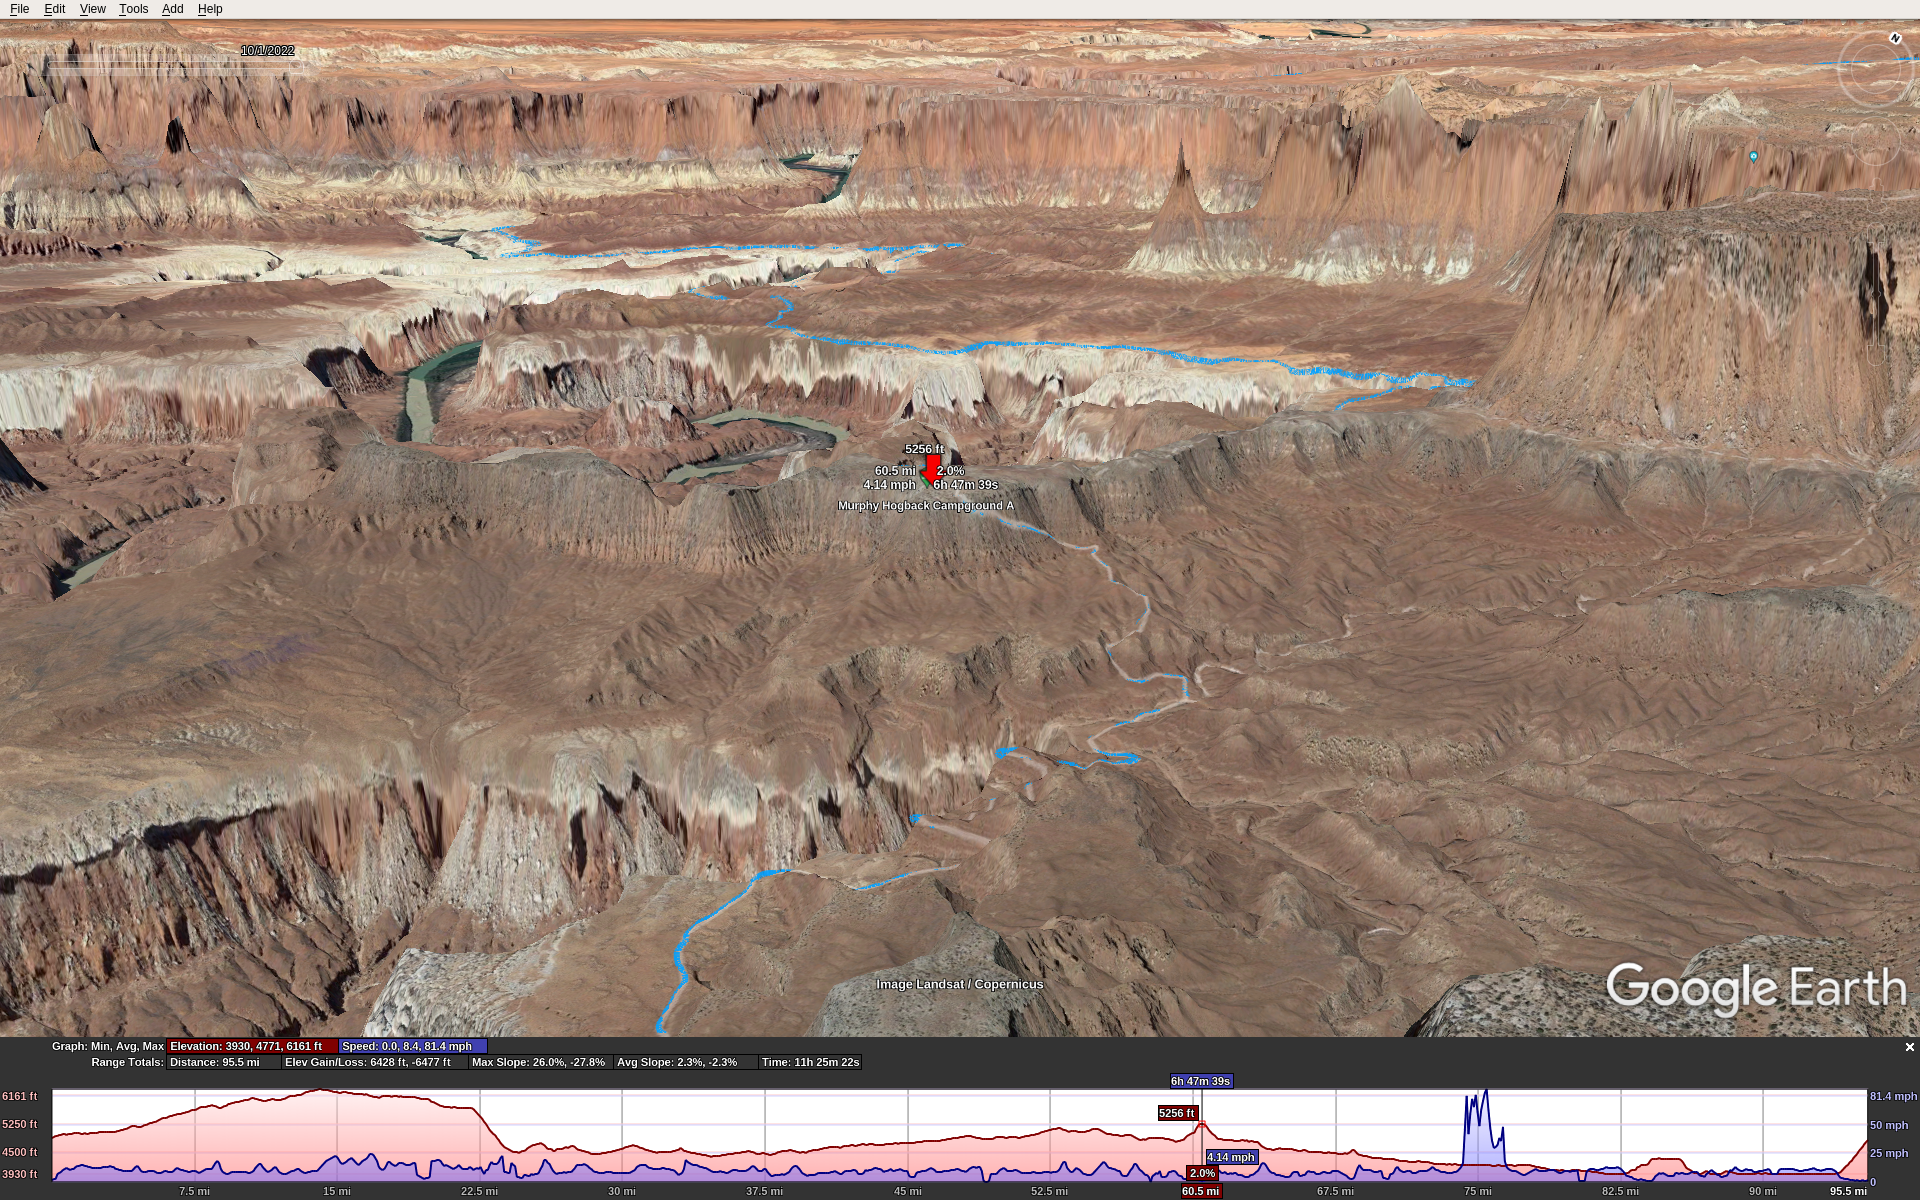
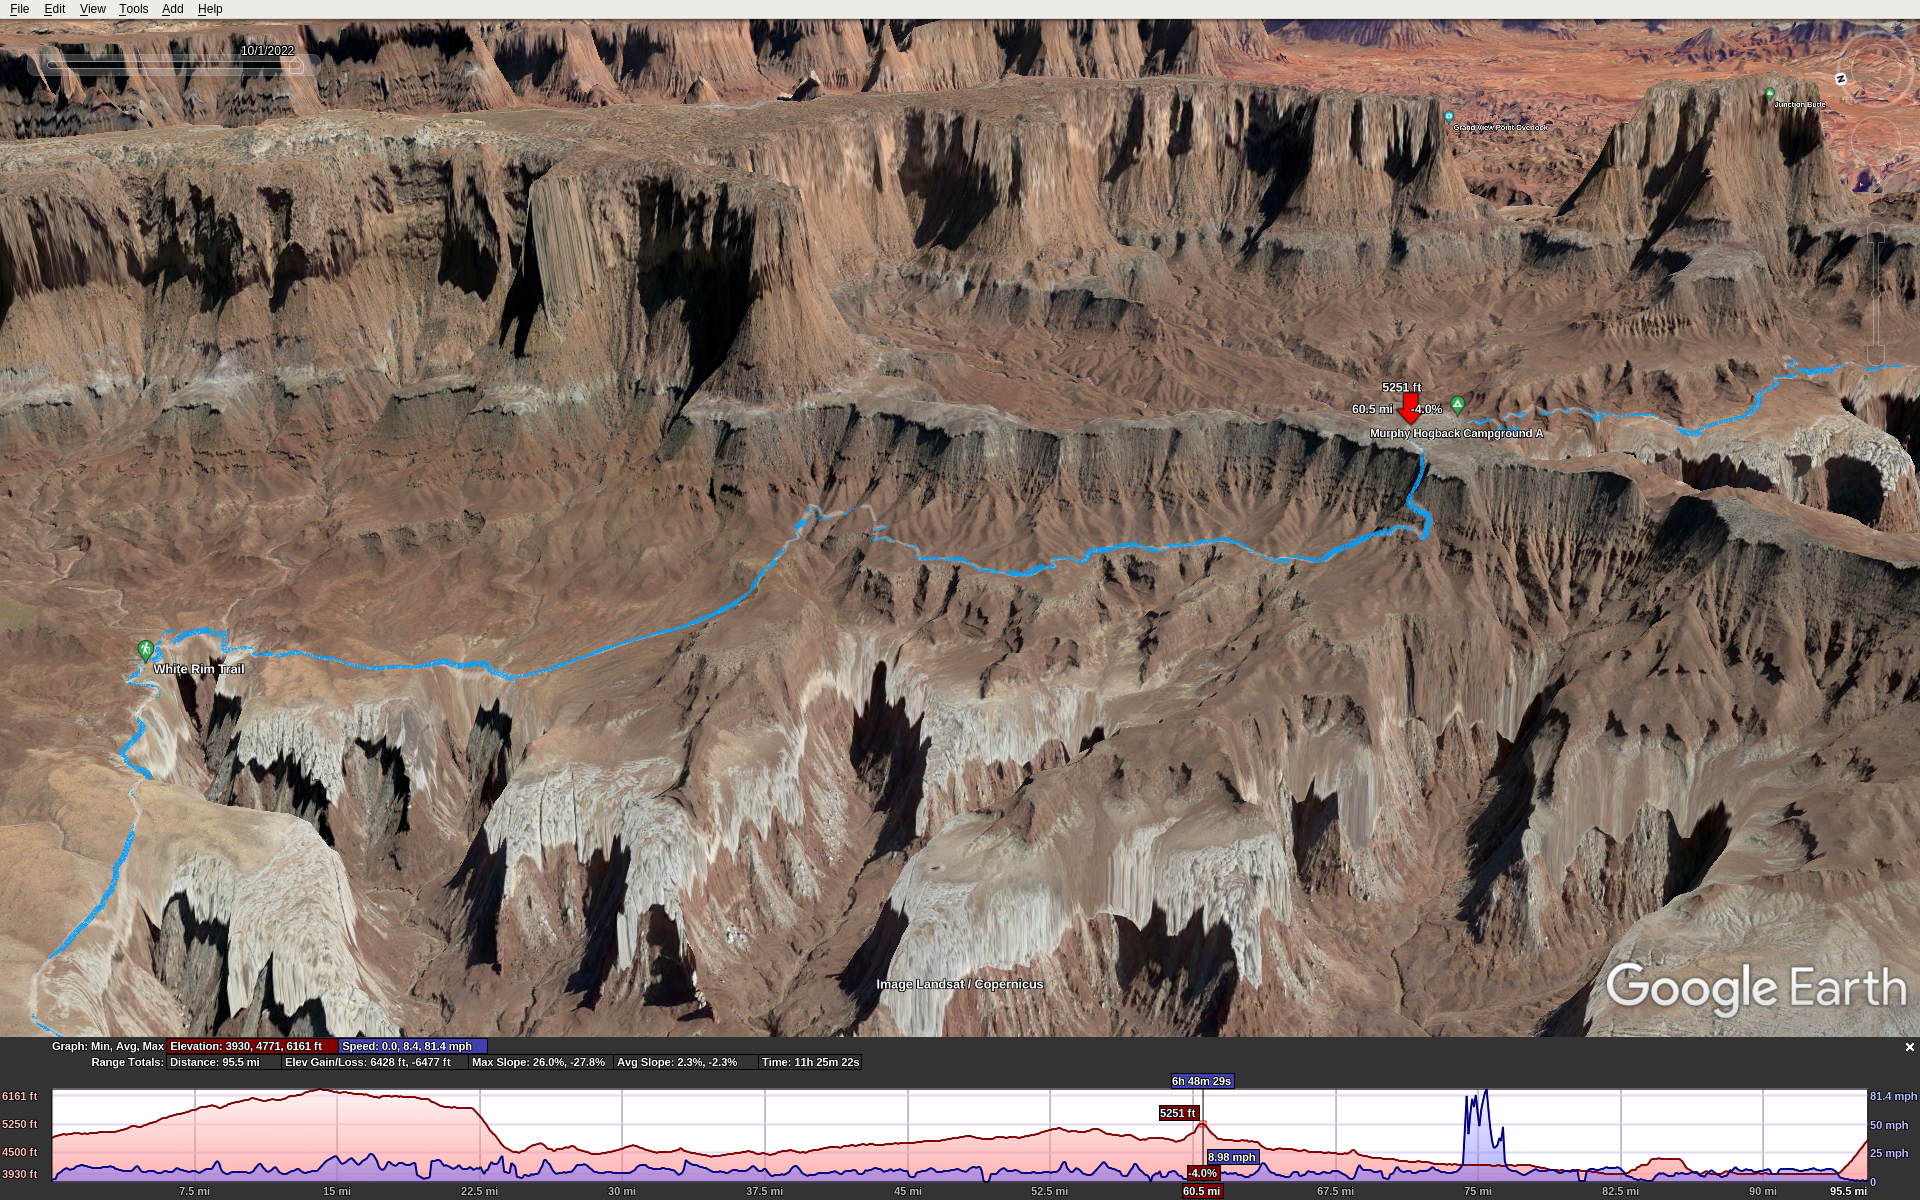
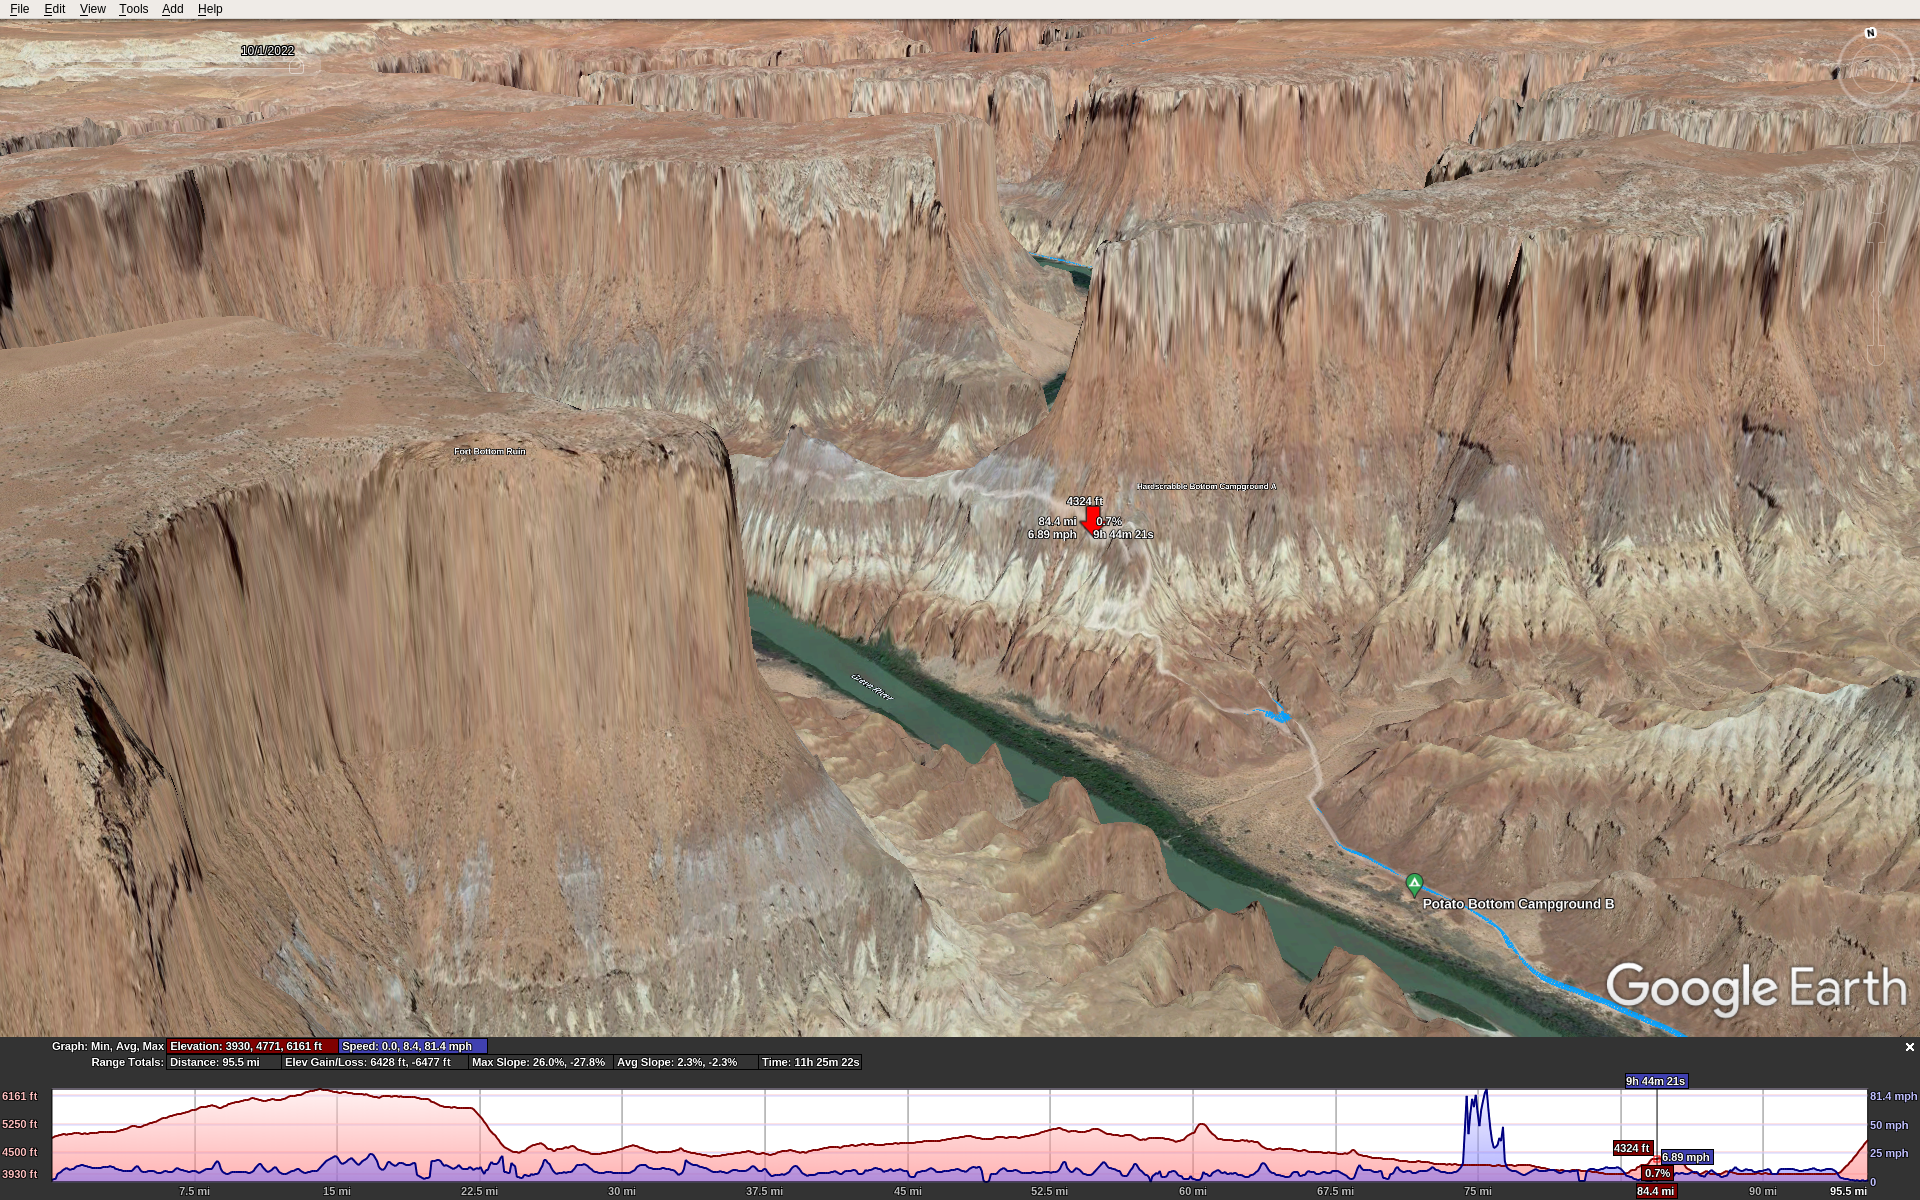
Also, along the trail in the canyon are 2 big notable climbs, each close to 1000′ with some sections too steep to ride. So no matter which way you go, you’ll have 3 very big climbs, in addition to the constant up and down of the trail.

Climb 1, Murphy Hogback, the up side:

Climb 1, Murphy Hogback, the down side:

Climb 2, Hardscrabble Bottom, the up side:

Climb 2, Hardscrabble Bottom, the down side:

We went clockwise starting from the NW corner of the route: the parking lot and toilet just at the top of the Mineral Bottom Climb. This means starting with a 12 mile dirt/gravel road ride that gradually climbs about 1200′, then turning right onto the paved road that runs into the park. Total distance to the Shafer descent where you enter the canyon trail is about 20 miles. Then you ride another 79 miles along the White Rim Trail, and then climb up Mineral Bottom back to where you started. It’s about 1000′ in 1 mile.

The east half of the ride is easier than the west half. It’s just a bit flatter, less sand, less rugged & technical. So the drawback of the clockwise route is that the toughest riding is in the second half of the ride. However, the Mineral Bottom climb, as tough as it is, isn’t quite as rugged or long as the Shafer climb.

Getting There

I flew from Seattle into Moab in my C-172, Stefan drove from Boulder, and we met at the Moab airport KCNY. We stayed at the Moab Apache Inn. It’s not fancy, but it’s a good place with truly excellent service/management.

Sunrise was at 6:45, so that’s when we started. Temps in early Oct were in the mid-high 50s at the start and got into the 70s during the day. This was fortunate!

The Ride

Our start point was at 4800′ MSL. The way we rode, we started along the dirt/gravel road on a long gradual climb. This was nice because it was cool out and the climbing kept us warm so we didn’t need to bring jackets that we would only doff later and carry all day. At mile 12 we reached the paved road (Hwy 313) which is near the peak elevation of about 6000′. We turned S towards the park. After entering the park, a short distance more put us at the top of the Shafer grade with 20 miles on the odometer.

The Shafer descent is just rugged and steep enough to keep you on your toes. If you slide out and miss a turn it could lead to a fatal fall. It was no problem on my full suspension bike but you would not want a gravel bike or skinny tires. It’s incredibly scenic. A short distance and about 1000′ of descent later, you’re in the canyon on the trail. To call it scenic is a grave understatement. It’s stunning.

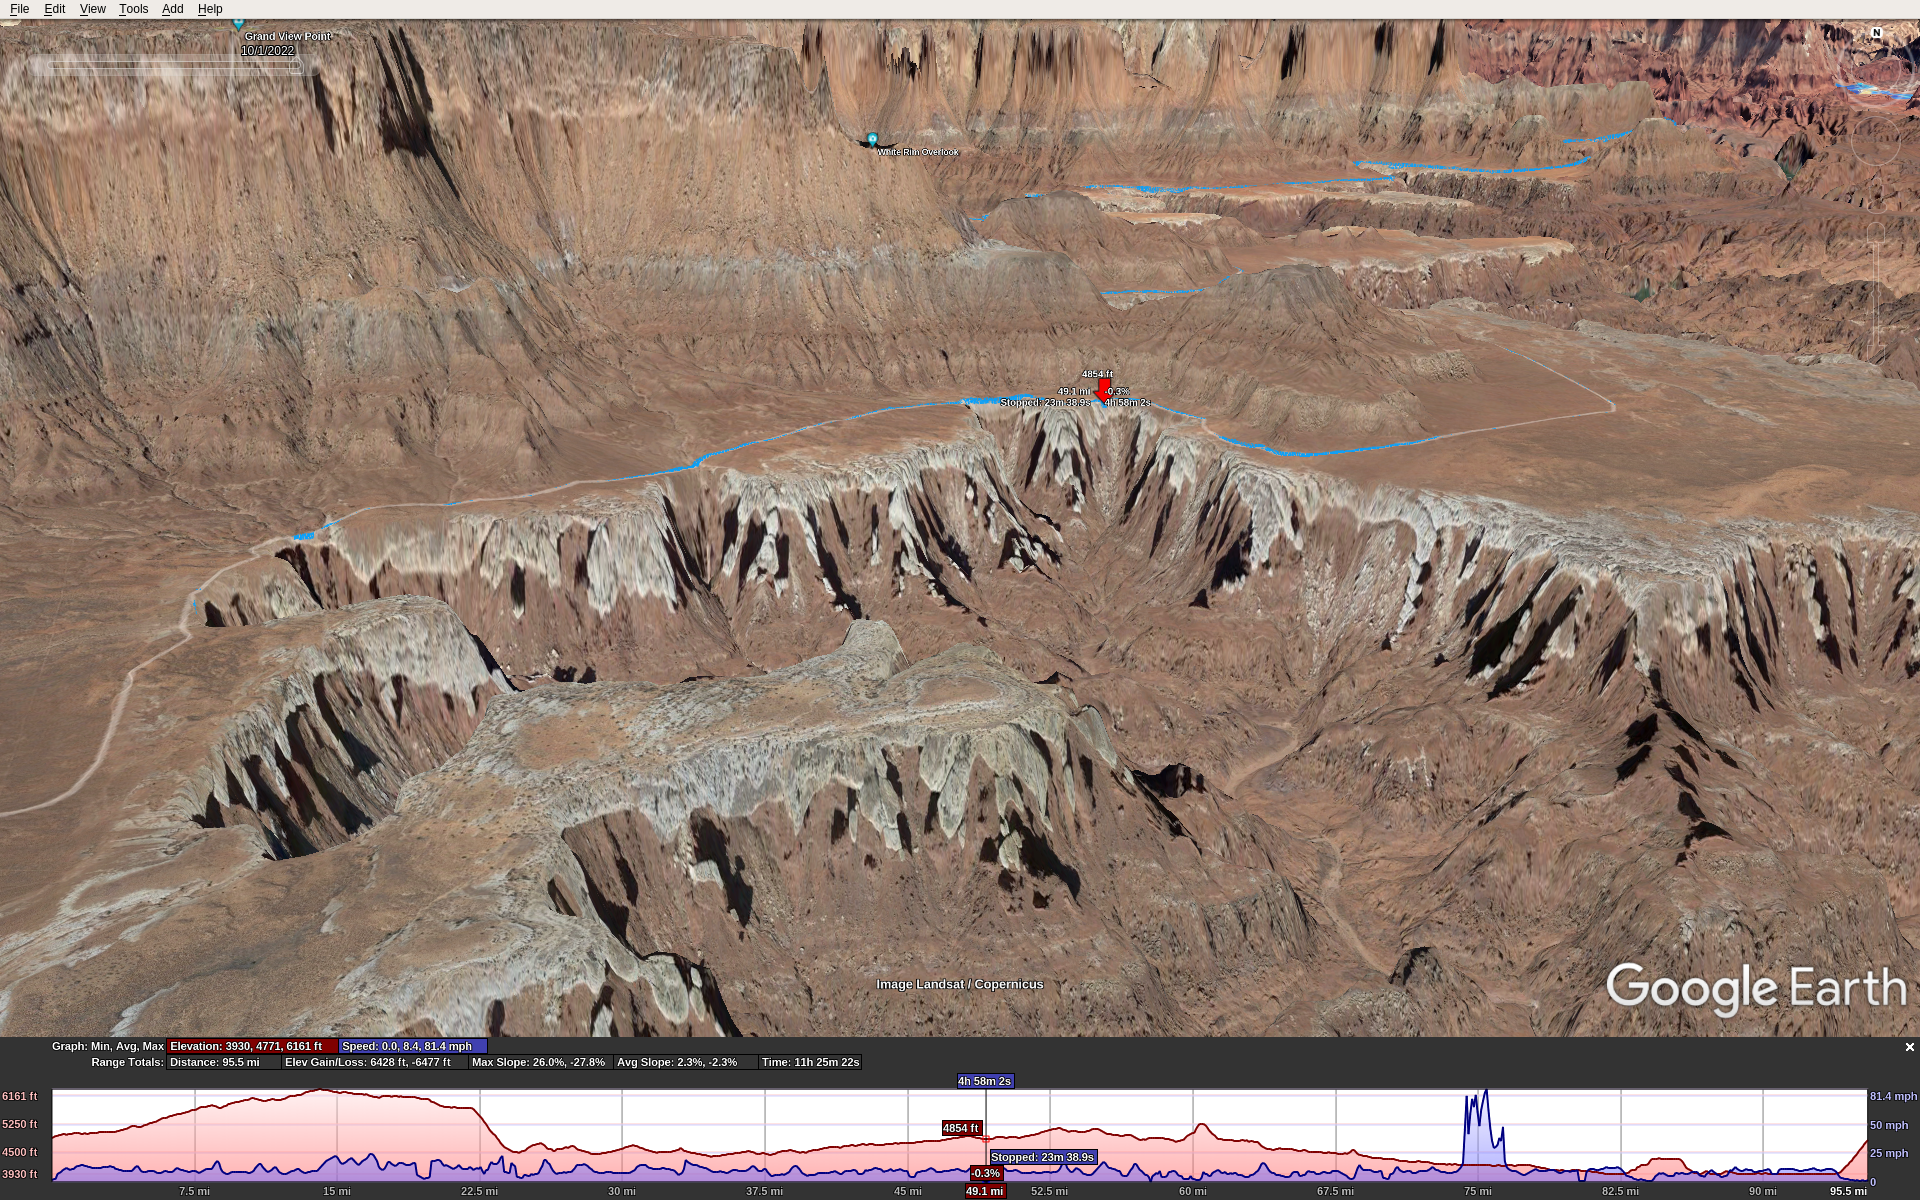
Here (red marker) is where we had lunch, around mile 55:

For the next 43 miles or so you ride along the rims of canyons, weaving in and around following the contours. Then you reach one of the big steep climbs at Murphy Hogback Canyon. Some parts of this are too steep to ride. It just goes up and up. The top levels off for less than a mile then you go down an equally steep opposite side.

The next 20 miles or so is a gradual downhill, but don’t let the word “downhill” fool you. It’s got long sections of soft sand which sucks down tires, forcing you to pedal hard at slow speed despite the downhill grade.

At this point I encountered nutrition difficulties. I brought Kind bars to eat throughout the day, because they are low sugar and worked great for me in all-day rides over the years. Yet starting around mile 65 I couldn’t keep them down; as I ate them I got a strong urge to barf them back up, so I had to stop eating them. Fortunately, Stefan had some spare Fritos and I had no problem eating those. I never considered chips to be an ultra-endurance food, but sometimes during adversity we learn new things about ourselves. In hindsight it makes sense: Fritos are simple carbs (but no sugar), plenty of salt, and calorie dense. I don’t think the problem was electrolyte loss because I had Nuun mineral tablets in all my water.

Then you reach the second big climb, Hardscrabble Bottom. It’s every bit as tough as the Murphy Hogback climb, ultra steep with some sections too steep to ride. Ride along the top for about 2 miles or so, rolling up and down varying from decent to rough technical conditions. Then back down the other side takes you to around 4000′ MSL about the level of the Green River.

Now ride along a decent quality trail following the Green river for about 15 miles or so, mostly flat. Then around mile 99 you reach the right turn to go up Mineral Bottom. Only 1 mile to go, but it’s very steep, nearly 1000′ climb.

At the end of the ride I didn’t feel right – eating or drinking would have triggered vomiting. I think it was temporary over-exertion because over the 1st post-ride hour I slowly sipped 12 oz of water and kept it down, and over the next hour I felt fine. An hour later we ate a big dinner in town, no problem.

Conclusion

WRIAD was a bucket-list ride for me. The preparation and execution consumed nearly a year of my life. I got into the best physical condition I’ve ever been, similar to doing La Ruta over 20 years ago. Even so, it was one of the toughest rides I’ve ever done, if not the very toughest. I’m pretty sure I’ll never do it again, but big rides like this come with satisfaction and confidence equal to what you put into them. Thanks Stefan for suggesting this one! It was an epic adventure.