All posts by Mike Clements

How Loud Does it Get?

Magnepan 3.6/R specs don’t give efficiency, but they give voltage sensitivity. That’s 86 dB @ 500 Hz @ 2.83 V. From this we can determine efficiency.  500 Hz is carried by the midrange panel which has 4.2 Ohm impedance, so 2.83 V drives 2.83/4.2 = 0.674 A of current, which makes 2.83 * 0.674 = 1.907 Watts.

So, 1.9 W of power makes 86 dB SPL at 1 meter. That’s lowish efficiency for a speaker.

The Adcom 5800 is rated at 400 W continuous in each channel with 2.1 dB of headroom. 400 W is 10 * log (400 / 1.9) = 23 dB louder than 1.9 W, which makes 86+23 = 109 dB SPL in each speaker. 2 speakers is twice the power which is +3 dB making 112 dB SPL from both speakers. Plus 2.1 for headroom makes 114 dB SPL peak.

At this power level, what is the voltage and current? We have 400 W into 4 ohms, which is 40 Volts and 10 Amps. That’s per channel.

I’m ignoring distance mainly because (A) dispersion is line source not spherical so it decays less with distance and (B) it’s in a room so some energy is not lost but reflected back, and (C) listener position is close, only about 2 meters from the speakers.

Subjectively, I can say this is VERY loud. Over the 26 years I’ve owned this amp I can count on the fingers of 1 hand the number of times I’ve seen its yellow 1% distortion warning lights briefly flicker during a transient peak.

NOTE: I tested this last night by holding an SPL meter while listening to a test CD. A full scale (0 dB) digital signal, passing through my preamp (Oppo HA-1) with volume at 0 dB measures 104 dB SPL at the listening position. The power amp (Adcom 5800) warning lights do not even flicker. The preamp goes up to +6 dB output, which would be 110 dB SPL. That’s pretty close to the theoretical measurement–within 2 dB.

That 2.1 dB of headroom means peak power is 10^(2.1/10) = 1.62 times higher than continuous, making 400 * 1.62 = 648 Watts.

Also we can sanity check the amp’s overall efficiency. The 5800’s max continuous power draw is rated at 1800 VA (Watts). While delivering 800 W to a pair of speakers (400 per speaker), that’s 44% efficient. It’s actually less efficient at lower volumes because it’s biased to run in symmetric class  A up to about 10 Watts output. The max theoretical efficiency of class A is 25%. It’s rated to draw about 250 W when idle.

Next question: if the Adcom 5800 operates in symmetric class A up to 10 W, how loud can it play these speakers while in class A, before transitioning to class AB?

From above, the speakers play at 86 dB SPL when consuming 1.907 watts. 10 watts is 7.2 dB louder, plus 86 = 93.2 dB SPL. That’s per side, so +3 dB makes 96.2 dB SPL. That’s very loud. But most likely, the transition from A to AB depends on voltage not current so the power level will vary depending speaker impedance.

Double-check the answer: 400 watts is 16 dB louder than 10, so add 16 dB to 96.2 and you get 112.2 dB. The math checks: same answer as above.

What Input is Required?

As mentioned above, the Adcom 5800 max continuous power both channels driven into 4 ohms, is 400 W, which is 40 V and 10 A. What voltage output from the preamp is needed to achieve this?

The Adcom 5800 gain is 29 dB with unbalanced inputs and 26 dB with balanced. These are ratios of 28.18:1 and 19.95:1 respectively. So the input voltage needed to achieve those output levels is 40 V divided by these ratios. That is 1.419 V unbalanced, or 2.0 V balanced. This is also known as the Adcom’s input voltage sensitivity.

However, those are continuous ratings and the Adcom has 2.1 dB of headroom, and 2.1 dB is a voltage ratio of 1.274:1. So to really crank it to max rated levels you’d need 1.274 times that voltage, which is 1.78 V unbalanced or 2.55 V balanced.

Let’s do the math the other way to double check. 2.55 V input, times 19.95:1 gain ratio is 50.8 V. Into a 4 ohm load draws 12.7 A, and the product of voltage and current is 50.8 * 12.7 = 645 Watts. This jives with the Adcom 5800’s rated peak power of 648 Watts.

Bits and Dynamic Range

When digital audio came out I wondered how the number of bits per sample correlated to the amplitude of waves. I imagined that the total expressible range was independent of the size of the smallest discernible gradation. Since this appeared to be a trade-off, I wondered how anyone decided what was a good balance.

Later I realized this is a false distinction. First: the number of bits per sample determines the size of the smallest gradation. Second: total expressible range is not a “thing” in the digital domain. Third: if the total range is a pie of arbitrary size, dynamic range is the number of slices. The smaller the slices, the bigger the dynamic range.

Regarding the first: to be more precise, bits per sample determines the size of the smallest amplitude gradation, as a fraction of full scale. Put differently: what % of full scale is the smallest amplitude gradation. But full scale is the amplitude of the analog wave, which is determined after D/A conversion, so it’s simply not part of the digital specification.

Amplitude swings back and forth. Half the bits are used for negative, the other for positive, values. Thus 16 bit audio gives 2^16 = 65,536 amplitudes, which is 32,768 for positive and negative each (actually one of the 65,536 values is zero, which leaves an odd number of values to cover the + and – amplitude swings, making them asymmetric by 1 value, which is a negligible difference). Measuring symmetrically from zero, we have 32,768 amplitudes in either direction. So the finest amplitude gradation is 1/32,768 of full scale in either direction, or 1/65,536 of peak-to-peak. 16-bit slices the amplitude pie into 65,536 equal pieces.

Here’s another way to think about this: the first bit gives you 2 values and each additional bit doubles the number of values. Amplitude is measured as voltage, and doubling the voltage is 6 dB. So each bit gives 6 dB of range, and 16 bits gives 96 dB of range. But this emphasizes the total range of amplitude, which can be misleading because what we’re really talking about is the size of the finest gradation.

So let’s follow this line of reasoning but think of it as halving, rather than doubling. We start with some arbitrary amplitude range (defined in the analog domain after the D/A conversion). It can be anything; you can suppose it’s 1 Volt but it doesn’t matter. The first digital bit halves it into 2 bins, and each additional bit doubles the number of bins, slicing each bin to half its size. Each of these halving operations shrinks the size of the bins by 6 dB. So 16 bits gives us a bin size 96 dB smaller than full scale. Put differently, twiddling the least significant bit creates noise 96 dB quieter than full scale.

To check our math, let’s work it backward. For any 2 voltages V1 and V2, the definition of voltage dB is:

20 * log(V1/V2) = dB

So 96 dB means for some ratio R,

20 * log R = 96

where R is the ratio of full scale to the smallest bin. This implies that

R = 10 ^ (96/20) = 63,096

That’s almost the 65,536 we expected. The reason it’s slightly off, is that doubling the voltage is not exactly 6 db. That’s just a convenient approximation. To be more precise:

20 * log 2 = 6.0206

So doubling (or halving) the voltage changes the level by 6.0206 dB. If we use this more precise figure, then 16 bits gives us 96.3296 dB of dynamic range. If we compute:

20 * log R = 96.3296

We get

R = 10 ^ (96.3296 / 20) = 65,536

When the math works, it’s always a nice sanity check.

Summary

The term dynamic range implies how “big” the signal can be. But it is both more precise and more intuitive to imagine the concept of dynamic range as the opposite: the size of the smallest amplitude gradation or “bin”, relative to full scale. Put differently: dynamic range is defined as the ratio of full scale, to the smallest amplitude bin.

With 16 bits, that smallest bin is 1/65,536 of full scale, which is 96 dB quieter. With 16-bit amplitudes, if you randomly wiggle the least significant bit, you create noise that is 96 dB below full scale.

With 24 bits, that smallest bin is 1/16,777,216 of full scale, which is 144 dB quieter. With 24-bit amplitudes, if you randomly wiggle the least significant bit, you create noise that is 144 dB below full scale.

Typically, the least significant bit is randomized with dither, so we get half a bit less dynamic range, so for 16-bit we get 93 dB and 24-bit we get 141 dB.

Practical Dynamic Range

Virtually nothing we record, from music to explosions, requires more than 93 dB of dynamic range, so why does anyone use 24-bit recording? With more bits, you slice the amplitude pie into a larger number of smaller pieces, which gives more fine-grained amplitude resolution–and, consequently, a larger range of amplitudes to play with. This can be useful during live recording, when you aren’t sure exactly how high peak levels will be. More bits gives you the freedom to set levels conservatively low, so peaks won’t overload, but without losing resolution.

Another reason that 24 bits can be useful is related to the frequency spectrum of musical energy. Most music has its maximum energy at or near its lowest frequencies, and from the lower midrange upward, energy usually drops by around 6 dB / octave. By the time you get to the top octave, the level is down 30 dB or more, so you’ve lost at least 5 bits of resolution — sometimes more. You might think that 16 – 5 = 11 bits is enough. But since the overall level was below full scale to begin with, you don’t have 16 bits. You typically have only 8 bits for these high frequencies, which is only 48 dB. Recording in 24-bit gives you 8 more bits which solves the problem, giving you 16 bits in this top octave.

Back in the late 80s there was another solution to this, part of the CD Redbook standard called “emphasis”. They applied an EQ to boost the top octave by about 10 dB before digitally encoding it, giving about 2 bits more resolution. Then after decoding it, then cut it by the same amount. In principle, it’s Dolby B for digital audio. However, this is never used anymore because the latest ADC and DACs are so much better now than they used to be.

However, once that recording is completed, you know what the peak level recorded was. You can up-shift the amplitude of the entire recording to set the peak level to 0 dB (or something close like -0.1 dB). So long as the recording had less than 93 dB of dynamic range, this transforms the recording to 16-bit without any loss of information (such as dynamic range compression).

In the extremely rare case that the recording had more than 93 dB of dynamic range, you can keep it in 24-bit, or you can apply a slight amount of dynamic range compression while in the 24-bit domain, to shrink it to 93 dB before transforming it. There are sound engineering reasons to use compression in this situation, even for purist audiophiles!

To put this into perspective: 93 dB of dynamic range is beyond what most people can pragmatically enjoy. Consider: a really quiet listening room has an ambient noise level around 30 dB SPL. If you listened to a recording with 93 dB of dynamic range, and you wanted to hear the quietest parts, the loud parts would would peak at 93 + 30 = 123 dB SPL. That is so loud as to be painful; the maximum safe exposure is only a couple of seconds. And whether your speakers or amplifier can do this at all, let alone without distortion, is a whole ‘nuther question. You’d have to apply some amount of dynamic range compression simply to make such a recording listenable.

Mechanical Keyboards: Why the Buckling Spring Rules!

I have quite a bit of experience with high quality keyboards. I learned to type on a manual typewriter, later graduated to electrics. My first computer was a TRS-80 CoCo which had a cheap chicklet type keyboard, up there with Apple’s laptops as one of the worst keyboards I’ve ever used. We soon upgraded it to one that had buckling spring mechanical key switches. It typed like an electric typewriter, which was awesome. Largely due to hours spent on that computer, I was typing 90+ wpm as a teenager (less common in the 1980s than it is now). In college I had a PC-XT clone, a Leading Edge Model D, which had another excellent keyboard. It felt like buckling springs, but may have had the Alps switches that were popular back then. All through the 1980s, just about every PC had this kind of keyboard. This keyboard defined “the sound of work” in offices across the USA.

Over the 90s cheap bubble dome keyboards became more common, until the turn of the century they were ubiquitous and it became nigh impossible to find a mechanical buckling spring keyboard. In 1999 I special ordered one from Unicomp and I still have it today; it works perfectly though it has an outdated PS/2 connector.

Later I discovered the ergonomic joy of ten-key-less 87-key keyboards. Chop off the numpad that you never use, and the mouse (trackball in my case) gets closer. The rest of the keyboard has the exact same layout (including home,end,arrows) as the classic IBM 101, so your hands and fingers know where to go without thinking. But it’s more comfortable because you don’t have to stretch your right arm as far to reach the mouse.

Problem: nobody makes an 87-key buckling spring keyboard (update: see below). I own and have extensively used a few 87-key keyboards with other mechanical switches: Cherry, Oetmu, Zorro. They’re way better than bubble dome switches (no double or missed strikes), but not as nice as buckling springs. Why? Two key differences:

  • Crisp: a buckling spring has a crisp snap when the key strikes. You can type with confidence, nary any doubt whether a light key hit struck. This tactile snap is strong and obvious, unlike clicky switches like Cherry Blues that I find barely perceptible.
  • Sound and Actuation: with a buckling spring, the click, the tactile bump, and key actuation are simultaneous. No so with most other switches. Commonly, the click and tactile bump happen before the key actuates.
  • Force: a buckling spring has a peak actuation force of around 75 grams, a bit more than other mechanical switches. This protects against accidental strikes when you are just resting your fingers on the keys, or your fingering is a bit sloppy and you barely brush an adjacent key.

It sounds small, but these two points make all the difference in the world. There is nothing like a buckling spring keyboard. Cherry and other mechanical switches are better than bubble domes, but pale in comparison.

Update: in 2021, Unicomp came out with the Mini-M, an 87-TKL with buckling springs. I am typing these words on this keyboard. It’s awesome!

High Bit Rate Audio

When CDs first came out in the 1980s they sounded lifeless. I still have several in my collection from those years and they still sound dull. In some ways they were better than LPs: no background rumble or hiss, much cleaner and tighter bass, uncolored midrange, and consistent sound quality unlike LPs that sound best in the outer groove with sound quality gradually deteriorating as the record plays and the needle moves toward the inner groove. At the end of the record, just when the orchestra is reaching is crescendo finale, you hear audible distortion or dynamic range compression because the inner groove can’t handle the dynamic range. CD avoided these issues. Yet by “lifeless” I mean the midrange detail, high frequencies and transient response on CD sounded worse than LP.

Over the 1990s, CDs improved until around the year 2000 I thought the best CDs had surpassed LPs, with better sounding high frequency and transient response, while retaining the other advantages they had all along. By this point, the best CDs of live acoustic music sounded more natural and real, where the best LPs sounded like an artistically euphonic sonic portrayal.

Looking back, one contributing factor to this transformation of CD audio quality may be the use of poorly implemented anti-aliasing filters in the early days. Over the 1990s, we owe the improvement in CD quality largely to digital oversampling and more transparent anti-aliasing filters, and partially to better implementations of dither and noise shaping.

At the same time, around the turn of the century, high bit rate formats came out: SACD and DVD-Audio. Various engineering and acoustic reasons are given for these high bit rates, most of which are based on well-intended yet fallacious understanding of digital audio, some on blatant pseudo-science.

The best explanation I’ve seen comes from a video by Monty Montgomery, and on his website, where he debunks the most common misunderstandings about digital audio. However, in his zeal to shed the light of math and engineering on this subject, he overstates the case in a few areas. Here I describe those areas. However, while I dispute these points, generally I do agree with Monty. He’s essentially got it right and is worth reading.

Audible Spectrum

Monty says, Thus, 20Hz – 20kHz is a generous range. It thoroughly covers the audible spectrum, an assertion backed by nearly a century of experimental data. This is mostly, yet not quite true. The range of human hearing is closer to 18 Hz to 18 kHz. It’s common for people to hear below 20 Hz, but almost nobody above the age of 15 can hear 20 kHz. For example, at age 50 as I write this, my personal hearing range is from around 16 Hz to 15 kHz.

Ironically, this actually strengthens Monty’s case. Digital audio has no problem going lower than 20 Hz, and we only need to go up to around 18 kHz to be transparent for 99% of people.

The Human Ear: Time vs. Frequency Domain

The ear is a strange device. Highly sensitive, yet inconsistent and unreliable. Our keen perception of transient response is more sensitive than one would expect, given the upper threshold of frequency tones we can hear.

For example, consider castanets. They have lots of high frequency energy, to 20 kHz and above. If you listen to real castanets–not an audio recording, but an actual person snapping them in front of you–the “snap” or “click” has an incredibly crisp, yet light and clean sound. Most recordings of them sound artificial with smeared transients, because these recordings don’t capture those high frequencies well. They’re lost somewhere in the microphone, the position of the mic to the musician, or the audio processing.

I have an excellent CD recording of castanets (it’s a flute quintet, but several tracks feature castanet accompaniment) that has energy up to 20 kHz. It’s one of the best, most realistic castanet recordings I have heard: clean, crisp yet light. Almost perfect sounding. As a test, I’ve applied EQ to this recording to attenuate frequencies above 15 kHz. I can differentiate this from the original in an A/B/X test. In the filtered version, the castanets don’t sound as crisp or clean. It’s hard to describe, but they sound slightly “smeared” for lack of a better word. The effect is subtle, but consistently noticeable when you know what to listen for, and listen carefully.

Yet as mentioned above, I can’t hear frequencies above 15 kHz, so I can’t hear the frequencies I attenuated. How is that possible? It may be that the ear is more sensitive to timing than it is to frequency. That is, it can detect transient response requiring higher frequencies to resolve, than it can hear as pure tones. Put differently: take a musical signal of castanets (or anything else with very high frequencies) and apply a Fourier Transform to convert to the frequency domain. The highest frequencies you cannot hear as pure tones. But if you filter them out, it distorts the original waveform in the time domain, rounding off sharp transients and causing pre-echo. The ear can detect these artifacts.

The moral of this story: well-engineered digital audio does perfectly capture any analog signal that has been bandwidth-limited to the Nyquist frequency. But, some caveats apply:

  1. Bandwidth-limiting the signal can create audible distortion. Anti-alias filtering with a steep slope creates audible time domain distortion in the pass-band.
  2. Higher sampling rates (alternately, oversampling) give a wider transition band, making a gradual filter slope, reducing this pass-band distortion.
  3. The frequencies needed for transient response to sound transparent, may be higher than the frequencies that people can hear as pure tones.

Of course, these points are not unique to digital audio. To get transparent transient response, every step in the recording chain must preserve high frequencies. You must use microphones with extended high frequency response, position them close enough to the musicians to capture the frequencies, etc.

Anti-Alias Filtering

The CD standard of 44.1 kHz sampling is not high enough to implement proper anti-aliasing filters that run on normal hardware (DAC chips) in real time. The proof of this assertion is in the specifications of nearly all common DAC chips: at the 44.1 kHz sample rate, their digital filter stop band is 24.1 kHz, which is above Nyquist.

The reason has to do with how aliasing works. Every frequency in the passband has an alias above Nyquist, and these frequencies are always mirrored around Nyquist. For example, at 44.1 kHz sampling the alias of 17 kHz is (22,050 – 17000) + 22,500 = 27,100 Hz. If we stretch the stop band from 22,050 to 24,100, then we allow frequencies from 22,050 to 24,100 to leak through. These are above Nyquist, so they are always noise. But since Nyquist (22,050) is exactly halfway between 20,000 (top of passband) and 24,100 (filter stop band), the passband aliases of this supersonic noise must necessarily all be above 20,000, thus inaudible to humans.

This engineering trick or kludge is clever, but the engineers designing these DAC chips would not resort to it unless it were necessary. At 44.1 kHz sampling, the transition band (20,000 to 22,050) is so narrow it’s impossible to implement a proper digital filter, so they bend the rules. Further proof is that the digital filters at higher sampling rates (88.2, 96, etc.) are properly implemented, with stop bands at Nyquist or lower.

Lossy Compression

Monty says: a properly encoded Ogg file (or MP3, or AAC file) will be indistinguishable from the original at a moderate bitrate. This is downright false — yet it depends on one’s definition of “moderate”. Trained listeners of high quality recordings on high quality equipment can reliably differentiate lossy compressed audio even at high bit rates (like 320 kbps MP3).

A/B/X testing the highest quality recordings in my collection, I can reliably distinguish MP3 up to about 200 kbps rates, using LAME 3.99.5, which is one of the best encoders. With some specialize recordings (jangling keys, castanets) I can differentiate them at the max 320 kbps rate. Most MP3s are done at 128 to 160 kbps thus could be differentiated from the original.

However, there is some truth to the “moderate bitrates are sufficient” viewpoint. Most MP3s are of rock, pop or electronic music, inferior quality master recordings that are compressed, clipped, and heavily EQed. The low 128 to 160 kbps rates may be transparent for this content. But that’s not relevant to us; here we’re talking about high end.

In short, if you are an experienced critical listener of high quality recordings on high quality equipment, you can hear the difference of MP3 and other lossy compression.

I’ve also got a few thoughts on dynamic range and 16 vs 24-bit. That’s a whole ‘nuther discussion.

Conclusion

What Monty says about digital audio is true, generally speaking. He’s done a great job of debunking common myths. High bit rate recordings are over-hyped and can actually be counterproductive. However, there are some caveats to keep in mind:

  1. High bit rate recordings often do sound better, because when they are being made, extra care and attention is used throughout the entire recording process.
    • But if you took that recording and down-sampled it to CD quality using properly implemented methods, it is likely to be indistinguishable from the original.
  2. High bit rate recordings may be sold as “studio masters”, not having dynamic range compression, equalization or other processing often applied to CDs.
    • This is related to (1), and the same comment applies.
  3. High bit rates can offer subtle improvements to transient (impulse) response.
    1. This benefit is intrinsic to high bit rate audio
    2. However, it is not always realized because the limiting factor for transient response may be the microphones or other parts of the recording process.
  4. High bit rates can sound worse, because they may capture ultrasonic frequencies that increase intermodulation distortion.
  5. The differences that high bit rates make (improvement or detriment) are subtle and most people don’t have good enough equipment or recordings to hear the differences.

Parting Words

Engineers may want to record at higher sampling rates with more bit depth to give headroom for setting levels and other processing. But their final result can virtually always be transformed to 44-16 without any audible compromises (distortion, compression, or loss of information). Yet in some areas, 44-16 while sufficient, is barely sufficient, which means it requires careful well engineered over-sampling, anti-aliasing filters, noise-shaped dither, etc.

High bit rate recordings, when done carefully, can offer slightly better transient response for certain types of music. But to the extent they actually do achieve this by accurately capturing higher frequencies that improve transient response (which is rare), this HF content is a double-edged sword that brings the risk of higher IMD distortion. Of course, high quality well-engineered audio gear (DAC, amp, speakers, etc.) mitigates this risk.

If you do use high bit rates, it doesn’t take much more than 44,100 to get the benefits. You don’t need 192k or higher. Most likely, 64k sampling would be enough to get all the advantages. But since that rate is never actually used, we’d go to 88,200 (twice the normal CD rate).

Some practical guidelines:

  • If the original recording was made in the 1980s or earlier, there is no point to high bit rates. Ultra high frequencies are already non-existent or rolled off, transient response is already imperfect, dynamic range is already limited. Here, the 44-16 standard is higher fidelity than the original.
  • If it’s rock, pop or electronic (whether old or new) there’s probably no point to high bit rates. It’s already heavily processed and there is no absolute reference for what this kind of music is supposed to sound like. Classic rock/pop albums get re-released every few years with different re-masterings that all sound different. One version may have better bass or smoother mids, but that is not a 44-16 limitation. Which release is “best” is not a limitation of digital bit rate, but only a matter of opinion.
  • If it is acoustic music recorded in natural spaces, a high bit rate recording may be useful, especially if the recording has very high frequencies (castanets, bagpipes, trumpets) or transient impulses. Even if the bit rate alone doesn’t help things, the entire recording is probably (though not always) made with more careful attention to detail and high engineering standards.

Overall, I don’t worry about it. The quality of a music recording depends far more on the mics used, their placement, the room it was recorded in, mixing and mastering, than it does on the bit rate. And 44-16 is either completely transparent, or so close to transparent that even on the highest quality equipment with the most discerning listener, limitations in other areas of the recording process make the differences mostly moot. However, for these rare special excellent recordings, I will get high bit rate versions if they’re available, if they haven’t been remastered and reprocessed to squeeze the life out of the music, and they don’t cost more than the CD.

Virtualbox and /usr/lib: FIXED

I ran Virtualbox today and nothing happened, as if I had not clicked its icon. There was no error message but I figured it was failing so I ran it from the command line and got the following error:

VirtualBox: Error -610 in supR3HardenedMainInitRuntime!
VirtualBox: dlopen("/usr/lib/virtualbox/VBoxRT.so",) failed: <NULL>
VirtualBox: Tip! It may help to reinstall VirtualBox.

When I Googled this I found all kinds of ideas, none of which worked. I checked the package versions, there were no version mis-matches. Finally I found an obscure thing that fixed it:

My /usr/lib directory was set to root:staff, mode 775. I had been working on Nixnote, an open source Evernote client, and needed to install some stuff there, so I changed the ownership so I wouldn’t have to sudo to copy new files there.

Well it turns out Virtualbox won’t run unless /usr/lib is root:root. Don’t ask me why, I don’t know and it doesn’t make sense. And Virtualbox doesn’t tell you this, nor is it mentioned in their docs. But setting it back fixed the problem.

Alaska 2018: Day 14 (12 of 12)

This is the last day of a trip to Alaska, part 12 of 12. Click here for the prior entry, here for the introduction.

I wanted a good meal so Dave and I hit the local W for breakfast. The don’t have a website, but they did make a good vegetarian omelette with great crispy cubed taters even if the coffee was weak.

Back at the hotel, I used their office space to get a weather briefing. Bad weather was still covering the Trench, but it was clearing out in parts so I would check again around 11am. Meanwhile, I read Yukon Wings, the book Bernd got me for my birthday. It’s a great book, and mine is signed by the author.

At 11, the weather looked better. We could definitely get to Prince George, and maybe Quesnel and Williams Lake. If not, we’d at least get over the mountains separating us from the Trench, and one step closer to home. I filed a flight plan to Williams Lake with an alternate for Quesnel. We checked out of the hotel, drove to the airport, and Bernd returned the car while I preflighted the plane and called the FBO to fuel us up.

20180721_130638_DRO
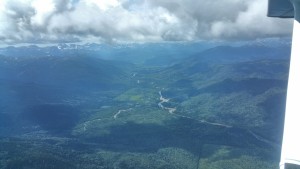
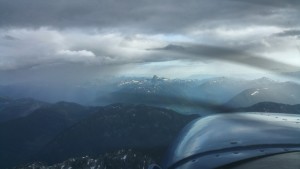
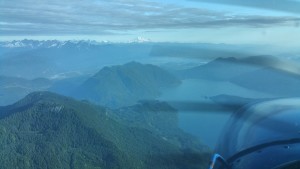
Approaching mtn pass SW of Ft. St. John

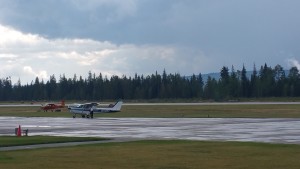
We departed at 12:30 local time heading SW. Skies were mostly scattered, broken in isolated areas, at about 8,000′. This is enough for good VFR through the passes to Prince George.

20180721_132742
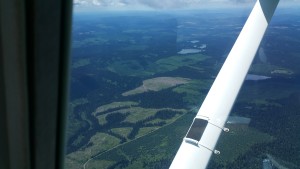
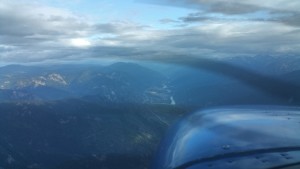
Hills in the trench NE of Prince George

The flight over the mountains, into the trench and past Prince George was scenic though uneventful. As we turned S toward Quesnel we could see small isolated thunderstorms in the distance ahead. I wasn’t going to fly into that so as we flew over Quesnel I called their MF and reported I’d land there.

Here, I encountered a difference between US and Canadian procedures. Quesnel (CYQZ) is a non-towered airport at elevation 1,800′, so pattern altitude is 2,800′. They have a class E airspace that goes up to 4,800′. I flew over and announced mid-field at 4,500′. This is a safe, legal way to approach a non-towered airport in the US. Midfield, you don’t conflict with arriving or departing traffic, and 1,700′ above pattern altitude puts you high enough to avoid conflicts with anyone in the pattern. And approaching from that height and direction, you have great visibility for any other planes in the area so you can smoothly merge into the pattern. However, in response to my radio call, the Canadian RCO berated me, saying I violated their airspace and should announce at least 5 miles out. They asked did I have a CFS on board? I assumed they meant a Canadian Flight Supplement and replied “affirmative”. Then the RCO said there were no other airplanes in the area so it did not cause any separation issues, don’t worry about it. I resisted the urge to reply that was obvious because from mid-field, 1,700′ above pattern at a non-towered airport, I was looking out for myself and could see that. Instead, I kept my mouth shut. “Nothing” is often a wise thing to say.

20180721_143755
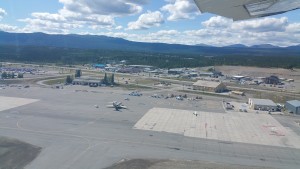
Quesnel

After I landed a local Canadian pilot walked up to my airplane, said he was listening on his radio, that I did nothing wrong, that RCO had been chewing out pilots for no good reason. He was going to call the RCO and complain about their poor service. I told him I was a visitor in their country and despite having studied the differences in US-Canada flight procedures, I could have missed something. I don’t know who was right: this friendly pilot or the RCO, so I’ll consider it a lesson learned: in Canada, the RCOs want you to announce before entering the class E area of an airport, even when the airport is non-towered.

After landing, we refueled and parked. About 30 minutes later, one of those scattered t-storms came through and dumped an amount of heavy rain that belied its small size.

Flight time: H 89.6 – 91.6 = 2.0 hrs
Flight track: https://hangar.naviatorapp.com/20353/cyxj-to-cyqz

I called NavCanada to get a briefing. Wiliams Lake was socked in, MVFR, but if we could get past there, we’d have clear conditions through Hope, Abbotsford and to Seattle. We decided to wait a couple of hours in Quesnel and check again. They have a nice pilot lounge so worst case, we could stay there for the night. We ordered a pizza and charged our devices while waiting.

The second weather briefing for Williams Lake looked better; the weather was moving to the E. And, 2 pilots entered the lounge on their way to Atlin. They had flown N from where we were going. They were older guys, experienced with the area. The pilot was a former FAA inspector. They said conditions were OK and we’d pass by just fine.

Armed with this knowledge, I filed an international flight plan from Quesnel to Williams Lake, Hope, Abbotsford, then Seattle. The prior day I had filed the EAPIS. I called Seattle customs for our arrival notification. Then we departed at 5:30pm expecting to arrive in Seattle at 9:30pm. We’d be early if I could cut the corner and skip Hope. Seemed like we’d been gone a long time, felt strange to imagine being back in Seattle.

Over the phone, the NavCanada briefer gave me a discrete squawk code to cross the border. After takeoff, the RCO gave me a different squawk code. I told him the briefer had given me another one. The RCO said that is unusual, they usually don’t do that. He couldn’t find the other code in the system so I went with his code 0022.

20180721_184418_DRO
Fraser River Valley
20180721_190858_DRO
Cut the corner for clear skies
20180721_191853
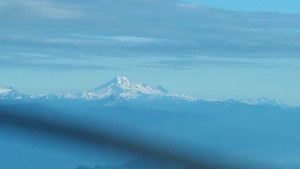
Mt. Baker from NE of Abbotsford

Once again, the flight was scenic yet uneventful. Since the leg was over 3 hours, I slowed down to medium power cruise for efficiency (2400 RPM) which gives over 5 hours of flight.

The long way is to follow the Fraser river all the way around to Hope then back to the W. This avoids the high altitudes needed to cross the northern Rockies. The short way is to cut the corner. On this day the SE end of the Fraser river was socked in with bad weather so we cut the corner through clear skies.

I called Abbotsford tower as we approached; they cleared us through their class C airspace (same female controller we had on Day 1, with the great sounding Australian accent) and handed us off to Victoria Approach to cross the border.

20180721_192039_DRO
Harrison Lake, NE of Abbotsford

Then we transferred to Whidbey Approach, after that cancelled flight following and continued direct to Boeing Field. We landed a few minutes ahead of schedule. Customs met us and the processing was quick and efficient. Taxi-ing back to NE parking, BFI ground didn’t reply to my radio call. Then the ground controller got grouchy with myself and several other aircraft and made several mistakes, mixing up our tail numbers and locations. Seems like he fell behind in whatever he was doing and was frustrated trying to catch up. No problem, we got our taxi clearance, tied down, unloaded and ended our 2-week adventure.

Flight time: H 91.6 – 94.8 = 3.2 hours
Flight tracks:
https://hangar.naviatorapp.com/20352/cyqz-to-wn51
https://hangar.naviatorapp.com/20351/wn51-to-wn93

Total flight time: H 59.7 – 94.8 = 35.1 hours

Alaska 2018: Day 13 (11 of 12)

This is day 13 of a trip to Alaska, part 11 of 12. Click here for the prior and next entries.

We breakfasted at the hotel then took a cab back to the airport to rent a car.  The bad weather that came in the prior night was fully upon us today. The airport was IFR. While there, I checked my airplane. It wasn’t tied down because I was on the grass, and the grass was a thin layer over hard concrete-like Earth so my screw-down grass stakes wouldn’t dig in. It was fine.

We drove to the local rodeo, but there was hardly anyone there except for the participants, and we didn’t want to sit outdoors in the rain to watch it. We’d come back tomorrow if we were still stuck here in Ft. St. John with better weather.

20180720_110028_DRO
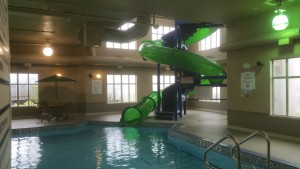
Not many hotels have a pool slide!

The hotel had a pool with a big spiral slide, so we stopped at the local Walmart to get swim trunks. I also replaced the charger I had left in Gulkana. We lunched at the Canadian Brewhouse, which was a decent place. Then returned to the hotel, went swimming, sliding and hot-tubbing for a couple of hours. We ate dinner at a local Greek place, the Olive Tree. Bernd called his old friend Pete the Greek from Sebastopol who spoke with the restaurant owner. Both grew up in nearby towns in Greece.

That evening we finished what little whisky we had left and hoped for good weather the next day. If we were lucky, we’d make it all the way home.


Alaska 2018: Day 12 (10 of 12)

This is day 12 of a trip to Alaska, part 10 of 12. Click here for the prior and next entries.

At the Takhini hostel, up at 7:30am, breakfasted on our groceries: coffee, Cheerios with bananas and toast with peanut butter. Skies looked clear but it was cold with low lying fog in the valleys. Optimistically, we checked out of the hostel and drove to the airport, which was IFR with a thin layer of fog. I used the pilot office to get a weather briefing: bad weather to the SE, a huge pile of cold moist air was socking in everything to the SE of us. Chances were, enough sun to burn it off would also be enough to make thunderstorms.

20180718_102803_DRO
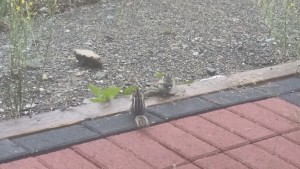
Chipmunk buddies at the hostel

We drove into Whitehorse to Starbucks. I planned an alternate route down the trench, Whitehorse to Dease Lake to Prince George, using paper charts and my tablet. Calculating this with the leg distances, headings, and fuel calculations took over an hour. Then I used the Starbucks WiFi to get an updated briefing. Conditions were improving.

We lunched at the local Vietnamese place, then back to the airport. At the pilot lounge I got an updated briefing. The center of the bad weather was over the trench, hammering it with big thunderstorms. No way were we getting through that, whether direct or via Dease Lake. But it looked like we could make it to Watson Lake, Nelson Lake, and maybe down to Ft. St. John. I filed a flight plan to Ft. Nelson, 2 legs, with enough time for a fuel stop at Watson Lake. If upon arriving Ft. St. John looked good, we’d fly that leg. Either way, we’d be a step or two further along our way.

20180719_140200
Departing Whitehorse for the last time
20180719_145745_DRO
Few above, scattered to broken below
20180719_161554
Watson Lake

We flew above the layers at first, then the layers got thicker and higher. When we got to 12,000′ and the layers were still rising, we descended below them and followed the valleys, dodging scattered rain showers that would develop into thunderstorms later in the afternoon.

Flight time: H 83.9 – 86.0 = 2.1 hrs
Flight track: https://hangar.naviatorapp.com/20338/cyxy-to-cyqh

20180719_181626
Fueling at Ft. Nelson

At Watson Lake we refueled and departed for Ft. Nelson. Since we came up the trench on our way out, this would be a new destination, further E along the AlCan highway.

Flight time: H 86.0 – H88.0 = 2.0 hrs
Flight tracks:
https://hangar.naviatorapp.com/20337/cyqh-to-ca-0207
https://hangar.naviatorapp.com/20336/cbf8-to-cyye

After arriving at Ft. St. Nelson, we refueled again and I got a briefing for the flight S to Ft. St. John. The bad weather was closing in, but the forecast was we could beat it there since it is only a 90 minute flight.

20180719_185102_DRO
Between Ft. Nelson and Ft. St. John

We departed and I ran the airplane at high speed cruise (2600 RPM, 120 kts TAS). As we headed S we had clear VFR under a high layer at 7,000′ to 8,000′, but we could see dim grey and rain in the distance, where we were heading.

The weather got to Ft. St. John ahead of schedule and beat us there. As we arrived the airport was reporting VFR, but we had to fly through MVFR heavy rain and limited visibility to get there. Fortunately, I always record the position of my destination airport with a VOR radial and distance. Without this, I would not have found the airport in these conditions, and would have had to turn around and head back to Ft. Nelson. VFR minimums (3 miles visibility) are sufficient for keeping the shiny side up, but not for navigation. My tablet app (Naviator) crashed just as we approached the worst of the poor visibility and had to find the airport, reminding me why I use VORs. We flew direct to the VOR, made a single left turn and the airport appeared right in front of us, spot-on the 100° radial at 6 miles. Winds favored runway 12, which was right in front of me. We landed, taxied to the grass, and unloaded, all in heavy rain as the ceilings lowered and weather worsened around us. Soon after, the airport went to IFR.

Flight time: H 88.0 – 89.6  = 1.6 hrs
Flight track: https://hangar.naviatorapp.com/20335/cyye-to-cfj7

The FBO let us inside. We called around and found a hotel that sent a shuttle to pick us up. While waiting we met a security lady who told us about the local rodeo. From her appearance and demeanor, I suspect she was a cowgirl herself. We shuttled to the hotel, walked to Boston Pizza for dinner, then hit the sack.

Alaska 2018: Days 10-11 (9 of 12)

These are days 10-11 of a trip to Alaska, part 9 of 11. Click here for the prior and next entries.

Bernd got a rental car delivered to the hotel and we drove to Starbucks for br20180717_094858_DROeakfast. We met the owner and also spotted a flyer for free guided nature hikes, one at 2pm. We checked out of the family hotel and into the hostel on Takhini hot springs road next to the public hot pools. Lunch at Whisky Jacks and saw David again. Stopped by the airport to get our sleeping bags out of the plane, then went to the float plane base S of town for the nature hike.

20180717_140919_DRO

Ingrid and Janie led the hike. They were friendly and knowledgable, and we had a nice group of about 10 people. We hiked out & back the scenic Miles Canyon trail, learned about local history, saw a bear swim across the river and climb up on our side about 1/4 mile away.

20180717_135943_DRO
Your travelers at Miles Canyon Trail
20180717_140227
Yukon flowing through Miles Canyon
20180717_152523_DRO
Why did the bear cross the river?
20180717_152555
To climb up the other bank
20180717_160516_DRO
Beavers around here somewhere…

After the hike we returned to the Takhini springs hot pools and spent over an hour in the water. We emerged completely enervated yet relaxed.

Bad weather was coming in and we’d be stuck in Whitehorse for another day or two.

At the hostel, another family checked in. They were a Swiss family of 5 and had spent the past 5 days hiking the pass from Skagway to Whitehorse.

Day 11, the bad weather had arrived. No way we’d be getting out today. We breakfasted at Bean North, lunched at the pizza place, and spent a few hours visiting the Yukon Transportation Museum.

We returned to the hot pools and met a Canadian couple, who recommended Ft. St. John as the best place to get stuck, of all the towns we’d hit along the way home. Back to town for grocery shopping, then back to the hostel. Met another arriving family, the parents were both teachers with 2 teenage daughters. We watched another movie and hit the sack.

Alaska 2018: Day 9 (8 of 12)

This is day 9 of a trip to Alaska, part 8 of 11. Click here for the prior and next entries.

20180716_092605
Loading the mail
20180716_093732
Packed tight, but weighed & balanced

We got up early, and Rebecca & Jody were already at work. We helped Jody load the 185 for the mail flight. It was stuffed to the gills, even so we took care to ensure it was within weight and CG.

20180716_105737
Flying with Rebecca

I got a weather briefing and things looked better. Rebecca was learning to fly, so we took her along in the right front seat for a local flight to see the sights, assess the mountain pass to the East, and give her some stick time.

Rebecca practised gentle un-coordinated turns (rudder only and aileron only) to get a feel for how too much rudder pulls you to the outside, too much aileron pulls you to the inside, and properly coordinated balances these forces, so it pulls you straight back into your seat. She also practised using a light fingertips touch on controls during cruise, trim it so the airplane’s inherent stability does the work. This enables you to better feel the airplane’s control forces talking back to you, reduces pilot workload and smooths the transition to instrument flight.

Flight time: H 78.8 – 80.3 = 1.5 hrs
Flight track: https://hangar.naviatorapp.com/20304/pagk-to-pagk

The pass was MVFR at best, but clearing, so we landed back in Gulkana and prepared to depart. Meanwhile, Rebecca showed us a mini-projector she used to watch movies from her phone. It was unusable with a broken power adapter. We found some solder in the aviation shop, a soldering iron, and I fixed it. The fix wasn’t the cleanest, but functional if fragile, and the best I could under the circumstances.

20180716_133847_DRO
Mentasta Lake up ahead

We said our good-byes and departed Gulkana for Tok, then Whitehorse. Due to the overcast, we followed the river through the mountains to Tok instead of taking Mentasta pass

This worked great. We landed in Tok, refueled, got a new weather briefing, filed EAPIS and called Customs for the flight to Whitehorse.

20180716_134354
IFR (I Follow Rivers) to Tok
20180716_161729
A rainbow between scattered showers

We departed Tok at 3pm and flew to Whitehorse via Northway, Beaver Creek, Silver Springs, then E to Whitehorse. Along the way we flew over some scattered cloud layers around Kluane Lake, then descended to fly under others. At one point we encountered small scattered thunderstorms, wide enough apart to slip between them. This put us in true old-school VFR flying through valleys following rivers and roads. We approached Whitehorse from the W through the mountain pass.

Tower gave us L downwind for 34R. We landed and tied down under the tower (not at the north ramp this time).

Flight time: H80.3 – 83.9 = 3.6 hrs (Gulkana to Whitehorse)
Flight track to Tok: https://hangar.naviatorapp.com/20305/8ak1-to-pfto
Flight track to Whitehorse: https://hangar.naviatorapp.com/20306/pfto-to-cyxy

Just behind us landed Scott in his Piper Cub. We met while fueling up. He was ferrying the airplane from Texas to Alaska for an owner. We walked to the terminal together and looked for a hotel and a place to eat. Whitehorse gets booked in the popular summer travel/cruise season. After several calls we couldn’t get a rental car but we got a room at the Family Hotel and took a taxi there. It doesn’t look like much from the outside, but they have nice staff (family owned) and great showers – incredible pressure and flow rate like standing under a waterfall! We walked to the local Boston Pizza for a hearty dinner, then hit the sack. Scott planned to get up early and on his way, so we would not see him again, at least not on this trip.